maptool
(Removed) Add menu tools to figure containing axesm-based
map
The maptool function has been removed. Select a replacement
function based on the desired menu item. For more information about replacement
functionality, see Version History.
Activation
Command Line |
|---|
|
Description
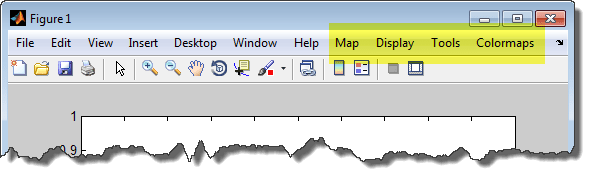
maptool adds several items to the menu in the current figure
window with an axesm-based map and opens the Projection Control
dialog box for defining map projection and display properties. The figure window
features a special menu bar that provides access to most of Mapping Toolbox™ capabilities.
maptool(
creates a figure window with an PropertyName,PropertyValue,...)axesm-based map defined by the
supplied map properties. The MapProjection property must be the
first input pair. maptool supports the same map properties as
axesm.
maptool( allows for the omission of the
ProjectionFile,PropertyName,
PropertyValue,...)MapProjection property name.
ProjectionFile must be the identifier of an available map
projection.
h = maptool(...) returns a two-element vector containing the
handle of the maptool figure window and the handle of the
axesm-based map.
Controls
Map Menu
The Lines option activates the Line Map Input
dialog box for projecting two- and three-dimensional line objects onto the
axesm-based map.
The Patches option activates the Patch Map Input
dialog box for projecting patch objects onto the axesm-based
map.
The Regular Surfaces option activates the Mesh
Map Input dialog box for projecting a regular data grid onto a graticule projected
onto the axesm-based map.
The General Surfaces option activates the Surface
Map Input dialog box for projecting a geolocated data grid onto the
axesm-based map.
The Contours option activates the Contour Map
Input dialog box for projecting a two- or three-dimensional contour plot onto the
axesm-based map.
The Quiver 2D option activates the Quiver Map
Input dialog box for projecting a two-dimensional quiver plot onto the
axesm-based map.
The Quiver 3D option activates the Quiver3 Map
Input dialog box for projecting a three-dimensional quiver plot onto the
axesm-based map.
The Stem option activates the Stem Map Input
dialog box for projecting a stem plot onto the axesm-based
map.
The Scatter option activates the Scatter Map
Input dialog box for projecting a scatter plot onto the
axesm-based map.
The Text option activates the Text Map Input
dialog box for projecting text objects onto the axesm-based
map.
Display Menu
The Projection option activates the Projection Control dialog box for editing map projection properties and map display settings.
The Graticule option is used to view and edit the graticule size for surface maps.
The Legend option is used to display a contour map legend.
The Frame option is used to toggle the map frame on and off.
The Grid option is used to toggle the map grid on and off.
The Meridian Labels option is used to toggle the
meridian grid labels
on and off.
The Parallel Labels option is used to toggle the parallel grid labels on and off.
The Tracks option activates the Define Tracks
input box for calculating and displaying Great Circle and Rhumb Line tracks on the
axesm-based map.
The Small Circles option activates the Define
Small Circles input box for calculating and displaying small circles on the
axesm-based map.
The Surface Distances option activates the Surface Distance dialog box for distance, azimuth, and reckoning calculations.
Tools Menu
The Hide option is used to hide the mouse tool buttons.
The Off option is used to turn off the current mouse tool.
The Set Limits option is used to define the zoom out limits to the current settings on the axes.
The Full View option is used to zoom out to the current axes limit settings.
The Origin option is used to toggle Origin mode on and off. Origin mode is used to interactively modify the map origin.
The 2D View option is used to set the default two-dimensional view (azimuth=0, elevation=90).
The Edit option activates the Property Inspector to manipulate properties of a plotted object. Choose the Current Object option to edit the currently selected object or choose the Select Object option to open the Select Object dialog box and choose the object you want to edit.
The Show option is used to set the
Visible property of mapped objects to
'on'. The All option shows
all currently mapped objects. The Object option
activates the Select Object dialog box.
The Hide option is used to set the
Visible property of mapped objects to
'off'. Choose from the All
or Map options, or choose the Object option to activate the Select Object dialog box.
The Delete option is used to clear the selected objects. The All option clears the current map, frame, and grid lines. The map definition is left in the axes definition. The Map option clears the current map, deleting objects plotted on the map but leaving the frame and grid lines displayed. The Object option activates the Select Object dialog box.
The Axes option is used to manipulate the MATLAB® Cartesian axes. The Show option shows this axes, the Hide option hides this axes, and the Color option allows for custom color selection for this axes.
Colormaps Menu
The Colormaps menu allows for manipulation of the colormap for the current figure.