3차원 파레토 경계 플로팅하기
이 예제에서는 3개 목적 함수에 대한 파레토 경계를 플로팅하는 방법을 보여줍니다. 각 목적 함수는 특정 3차원 점으로부터의 제곱 거리입니다. 계산 속도를 위해, 각 목적 함수를 벡터화하여 내적으로 작성합니다. 조밀한 해 집합을 구하려면 파레토 경계에 있는 200개 점을 사용하십시오.
이 예제에서는 내장된 "psplotparetof" 플롯 함수를 사용하여 플롯을 얻는 방법을 보여줍니다. 그런 다음 동일한 문제를 풀고 약간 다른 옵션 설정이 필요한 gamultiobj를 사용하여 플롯을 얻습니다. 이 예제에서는 파레토 플롯에서 특정 점에 대한 해 변수를 얻는 방법을 보여줍니다. 그런 다음 플롯 함수를 사용하지 않고 해당 점을 직접 플로팅하는 방법과, 파레토 점 대신 보간된 곡면을 플로팅하는 방법을 보여줍니다.
fun = @(x)[dot(x - [1,2,3],x - [1,2,3],2), ...
    dot(x - [-1,3,-2],x - [-1,3,-2],2), ...
    dot(x - [0,-1,1],x - [0,-1,1],2)];
options = optimoptions("paretosearch",UseVectorized=true,ParetoSetSize=200,...
    PlotFcn="psplotparetof");
lb = -5*ones(1,3);
ub = -lb;
rng default % For reproducibility
[x,f] = paretosearch(fun,3,[],[],[],[],lb,ub,[],options);
Pareto set found that satisfies the constraints.

Optimization completed because the relative change in the volume of the Pareto set
is less than 'options.ParetoSetChangeTolerance' and constraints are satisfied to within
'options.ConstraintTolerance'.
opts = optimoptions("gamultiobj",PlotFcn="gaplotpareto",PopulationSize=200);
[xg,fg] = gamultiobj(fun,3,[],[],[],[],lb,ub,[],opts);
gamultiobj stopped because the average change in the spread of Pareto solutions is less than options.FunctionTolerance.
이 플롯에는 paretosearch 플롯보다 훨씬 적은 개수의 점이 표시됩니다. 더 큰 모집단을 사용하여 문제를 다시 풉니다.
opts.PopulationSize = 400;
[xg,fg] = gamultiobj(fun,3,[],[],[],[],lb,ub,[],opts);
gamultiobj stopped because the average change in the spread of Pareto solutions is less than options.FunctionTolerance.
psplotpareto 플롯과 더 잘 일치하도록 시야각을 변경합니다.
view(-40,57)
데이터팁을 사용하여 해에 해당하는 점 구하기
데이터팁 툴을 사용하여 플롯에서 점을 하나 선택합니다.
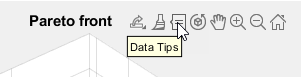
위 그림에 있는 점의 인덱스는 92입니다. 해당 점과 연결된 해 변수를 포함하는 점 xg(92,:)을 표시합니다.
disp(xg(92,:))
-0.2889 0.0939 0.4980
이 점에서 목적 함수를 실행하여 표시된 값과 일치하는지 확인합니다.
disp(fun(xg(92,:)))
11.5544 15.1912 1.5321
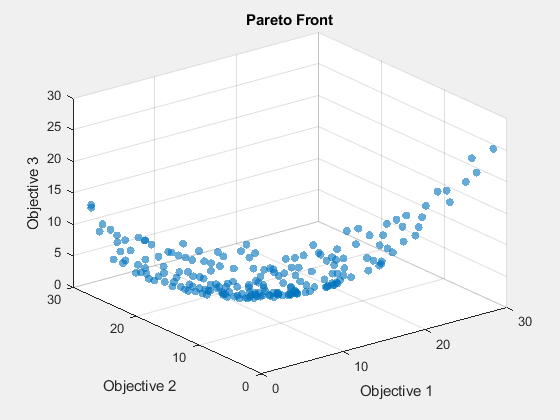
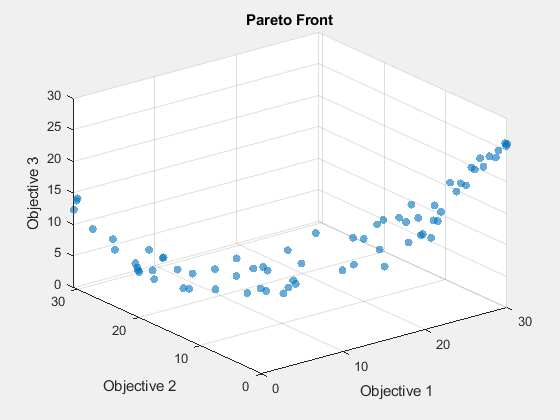
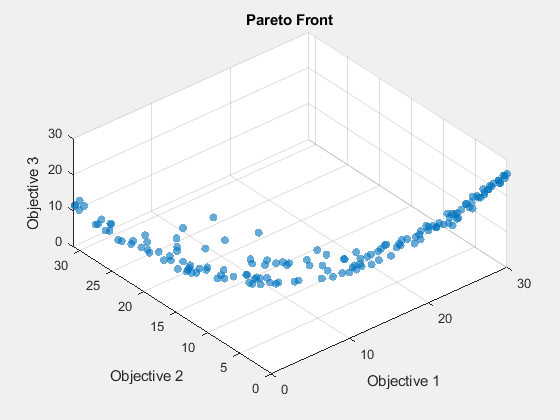
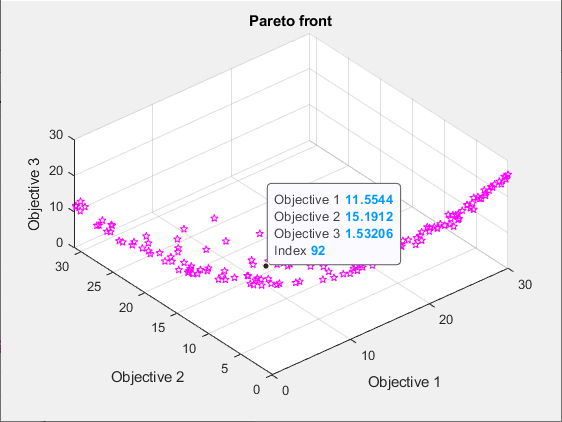
3차원 산점도 플롯 만들기
scatter3을 사용하여 파레토 경계에 있는 점을 플로팅합니다.
figure
subplot(2,2,1)
scatter3(f(:,1),f(:,2),f(:,3),".");
subplot(2,2,2)
scatter3(f(:,1),f(:,2),f(:,3),".");
view(-148,8)
subplot(2,2,3)
scatter3(f(:,1),f(:,2),f(:,3),".");
view(-180,8)
subplot(2,2,4)
scatter3(f(:,1),f(:,2),f(:,3),".");
view(-300,8)
플롯을 대화형 방식으로 회전하면 구조를 더 잘 확인할 수 있습니다.
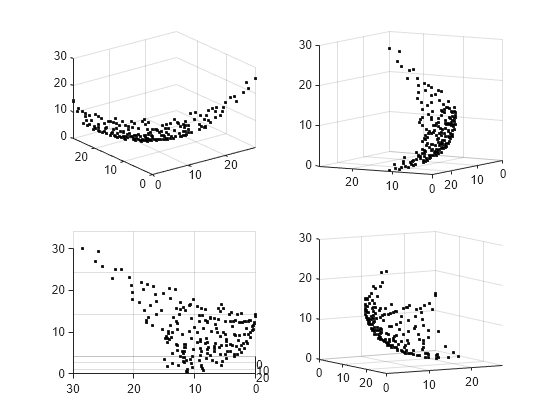
보간된 곡면 플롯
파레토 경계를 곡면으로 보려면 산점도 보간을 만듭니다.
figure
F = scatteredInterpolant(f(:,1),f(:,2),f(:,3),"linear","none");
결과로 생성된 곡면을 플로팅하려면 최솟값부터 최댓값까지의 x-y 공간에 메시를 만듭니다. 그런 다음 보간된 곡면을 플로팅합니다.
sgr = linspace(min(f(:,1)),max(f(:,1)));
ygr = linspace(min(f(:,2)),max(f(:,2)));
[XX,YY] = meshgrid(sgr,ygr);
ZZ = F(XX,YY);
파레토 점과 곡면을 함께 플로팅합니다.
figure
subplot(2,2,1)
surf(XX,YY,ZZ,LineStyle="none")
hold on
scatter3(f(:,1),f(:,2),f(:,3),".");
hold off
subplot(2,2,2)
surf(XX,YY,ZZ,LineStyle="none")
hold on
scatter3(f(:,1),f(:,2),f(:,3),".");
hold off
view(-148,8)
subplot(2,2,3)
surf(XX,YY,ZZ,LineStyle="none")
hold on
scatter3(f(:,1),f(:,2),f(:,3),".");
hold off
view(-180,8)
subplot(2,2,4)
surf(XX,YY,ZZ,LineStyle="none")
hold on
scatter3(f(:,1),f(:,2),f(:,3),".");
hold off
view(-300,8)
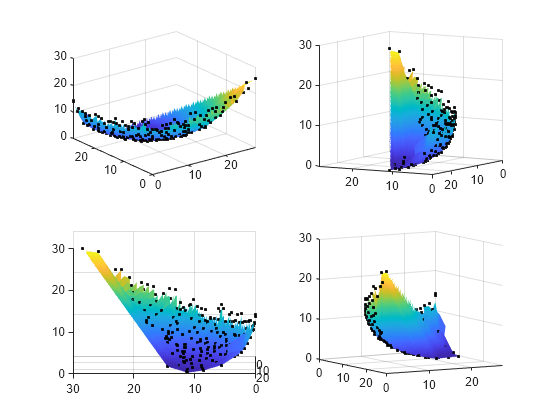
플롯을 대화형 방식으로 회전하면 구조를 더 잘 확인할 수 있습니다.
제어 변수 공간에서 파레토 집합 플로팅하기
"psplotparetox" 플롯 함수를 사용하여 파레토 집합에 있는 점 플롯을 얻을 수 있습니다.
options.PlotFcn = "psplotparetox";
[x,f] = paretosearch(fun,3,[],[],[],[],lb,ub,[],options);
Pareto set found that satisfies the constraints. Optimization completed because the relative change in the volume of the Pareto set is less than 'options.ParetoSetChangeTolerance' and constraints are satisfied to within 'options.ConstraintTolerance'.
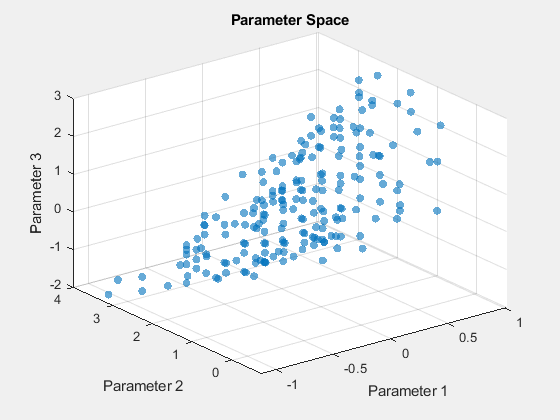
또는, 파레토 집합에 있는 x 값의 산점도 플롯을 만듭니다.
figure
subplot(2,2,1)
scatter3(x(:,1),x(:,2),x(:,3),".");
subplot(2,2,2)
scatter3(x(:,1),x(:,2),x(:,3),".");
view(-148,8)
subplot(2,2,3)
scatter3(x(:,1),x(:,2),x(:,3),".");
view(-180,8)
subplot(2,2,4)
scatter3(x(:,1),x(:,2),x(:,3),".");
view(-300,8)
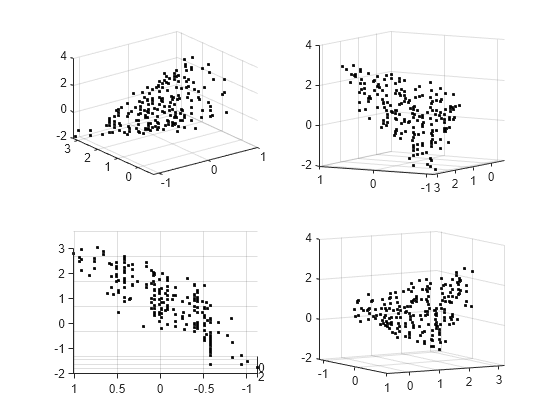
이 집합에는 명확한 곡면이 없습니다. 플롯을 대화형 방식으로 회전하면 구조를 더 잘 확인할 수 있습니다.
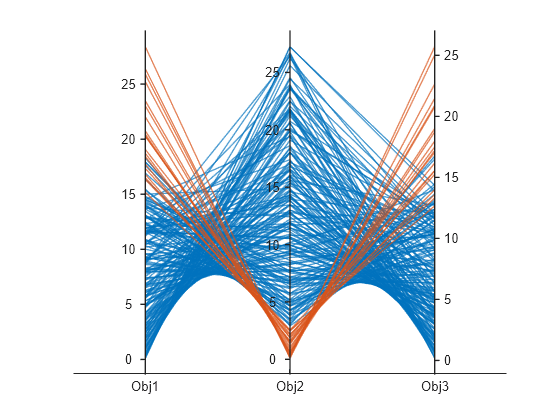
평행좌표 플롯
평행좌표 플롯을 사용하여 파레토 집합을 플로팅할 수 있습니다. 평행좌표 플롯은 임의의 차원 수에 대해 사용할 수 있습니다. 플롯에서, 각 컬러 선은 하나의 파레토 점을 나타내며, 각 좌표 변수는 연결된 세로선에 플로팅됩니다. parellelplot을 사용하여 목적 함수 값을 플로팅합니다.
figure
p = parallelplot(f);
p.CoordinateTickLabels = ["Obj1";"Obj2";"Obj3"];
Obj2 값의 하위 1/10에 속하는 파레토 점에 색을 입힙니다.
minObj2 = min(f(:,2));
maxObj2 = max(f(:,2));
grpRng = minObj2 + 0.1*(maxObj2-minObj2);
grpData = f(:,2) <= grpRng;
p.GroupData = grpData;
p.LegendVisible = "off";