getSectorCrossover
Crossover frequencies for sector bound
Description
returns the frequencies at which the following matrix
M(ω) is singular:wc
= getSectorCrossover(H
,Q
)
When a frequency-domain sector plot exists, these frequencies are the frequencies
at which the relative sector index (R-index) for H
and
Q
equals 1. See About Sector Bounds and Sector Indices for details.
Examples
Find Sector Crossover Frequency
Find the crossover frequencies for the dynamic system and the sector defined by:
for various values of a and b.
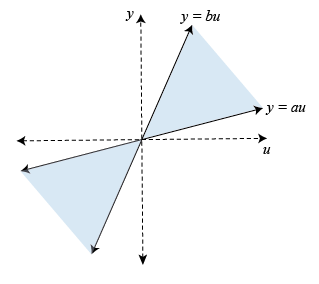
In U/Y space, this sector is the shaded region of the following diagram (for a, b > 0).
The Q
matrix for this sector is given by:
getSectorCrossover
finds the frequencies at which is singular, for . For instance, find these frequencies for the sector defined by Q
with a = 0.1 and b = 10.
G = tf([1 2],[1 1]); H = [G;1]; a = 0.1; b = 10; Q = [1 -(a+b)/2 ; -(a+b)/2 a*b]; w = getSectorCrossover(H,Q)
w = 0x1 empty double column vector
The empty result means that there are no such frequencies.
Now find the frequencies at which is singular for a narrower sector, with a = 0.5 and b = 1.5.
a2 = 0.5; b2 = 1.5; Q2 = [1 -(a2+b2)/2 ; -(a2+b2)/2 a2*b2]; w2 = getSectorCrossover(H,Q2)
w2 = 1.7321
Here the resulting frequency is where the R-index for H
and Q2
is equal to 1, as shown in the sector plot.
sectorplot(H,Q2)
Thus, when a sector plot exists for a system H
and sector Q
, getSectorCrossover
finds the frequencies at which the R-index is 1.
Input Arguments
H
— Model to analyze
dynamic system model
Model to analyze against sector bounds, specified as a dynamic
system model such as a tf
,
ss
, or genss
model.
H
can be continuous or discrete. If
H
is a generalized model with tunable or uncertain
blocks, getSectorCrossover
analyzes the current,
nominal value of H
.
To get the frequencies at which the I/O trajectories (u,y) of a linear system G lie in a
particular sector, use H = [G;I]
, where I =
eyes(nu)
, and nu
is the number of inputs of
G
.
Q
— Sector geometry
matrix | LTI model
Sector geometry, specified as:
A matrix, for constant sector geometry.
Q
is a symmetric square matrix that isny
on a side, whereny
is the number of outputs ofH
.An LTI model, for frequency-dependent sector geometry.
Q
satisfies Q(s)’ = Q(–s). In other words, Q(s) evaluates to a Hermitian matrix at each frequency.
The matrix Q
must be indefinite to describe
a well-defined conic sector. An indefinite matrix has both positive
and negative eigenvalues.
For more information, see About Sector Bounds and Sector Indices.
Output Arguments
wc
— Sector crossover frequencies
vector | []
Sector crossover frequencies, returned as a vector. The frequencies are
expressed in rad/TimeUnit
, relative to the
TimeUnit
property of H
. If the
trajectories of H
never cross the boundary, wc
= []
.
Version History
Introduced in R2016a
MATLAB 명령
다음 MATLAB 명령에 해당하는 링크를 클릭했습니다.
명령을 실행하려면 MATLAB 명령 창에 입력하십시오. 웹 브라우저는 MATLAB 명령을 지원하지 않습니다.
Select a Web Site
Choose a web site to get translated content where available and see local events and offers. Based on your location, we recommend that you select: .
You can also select a web site from the following list:
How to Get Best Site Performance
Select the China site (in Chinese or English) for best site performance. Other MathWorks country sites are not optimized for visits from your location.
Americas
- América Latina (Español)
- Canada (English)
- United States (English)
Europe
- Belgium (English)
- Denmark (English)
- Deutschland (Deutsch)
- España (Español)
- Finland (English)
- France (Français)
- Ireland (English)
- Italia (Italiano)
- Luxembourg (English)
- Netherlands (English)
- Norway (English)
- Österreich (Deutsch)
- Portugal (English)
- Sweden (English)
- Switzerland
- United Kingdom (English)