SC-FDMA vs. OFDM Modulation
This example compares Orthogonal Frequency Division Multiplexing (OFDM) with Single-Carrier Frequency Division Multiple Access (SC-FDMA). It highlights the merits of the latter modulation scheme in Long-Term Evolution (LTE) and Fifth Generation (5G) communication systems.
Introduction
LTE [1] and 5G New Radio (NR) [2] wireless systems for uplink transmissions from the mobile units to the base station. SC-FDMA has potential for sub-THz communications in Beyond 5G (B5G) [3]. Terms that define SC-FDMA include Discrete Fourier Transform spread OFDM (DFT-s-OFDM), Single-Carrier OFDM (SC-OFDM), and Linearly-Precoded OFDM Access (LP-OFDMA).
The premise behind SC-FDMA is to use the concept of OFDM, but precode the input signal such that the OFDM output mimics the characteristics of a single-carrier modulated signal within the same transmission bandwidth. Because SC-FDMA uses OFDM as the main transmission modulation scheme, the communications system preserves advantages of OFDM, such as time-frequency user multiplexing, resistance to frequency-selective fading, and frequency-domain equalization, which tends to be easier to implement than time-domain filter-based equalization.
The primary advantage of SC-FDMA is a lower peak-to-average power ratio (PAPR) in the transmit signal relative to that found in OFDM. One OFDM symbol contains many sinusoids with different frequencies and phases. The superposition of the many sinusoids occasionally results in constructive interference between sinusoids, which produces a very high peak amplitude relative to the average power of the signal. The problem with high PAPR occurs in both the digital and analog domains. In the digital domain, a high PAPR means that the output signal occasionally exceeds the dynamic range of the digital-to-analog converter (DAC) when the digital signal converts to an analog signal. This exceedance saturates the digital output, a type of distortion called clipping. In the analog domain, the output signal occasionally enters the nonlinear amplification region in the power amplifier of the transmitter. Nonlinear distortion creates undesirable out-of-band emissions in the form of high-order harmonics.
Another advantage of SC-FDMA is its robustness against spectral nulls from frequency-selective fading. In OFDM, a null in a subcarrier results in loss of data in that subcarrier. In SC-FDMA, the input signal spreads across subcarriers, so a null in a subcarrier also spreads across the subcarriers (hence the spreading effect in the DFT-s-OFDM name).
This example shows the similarity in the implementations of the two schemes and the difference in the impact of PAPR and spectral nulling.
System Parameters
Configure the simulation parameters for the system and transmitter. A larger number of simulated symbols (controlled by numSym) gives smoother performance curves, and a higher oversampling factor (controlled by osf) improves accuracy to catch peak amplitudes.
s = rng(11); % Set RNG state for repeatability % Simulation parameters numSym = 6000; % Number of OFDM symbols to modulate osf = 8; % Oversampling factor % OFDM parameters N = 256; % FFT length cpLen = 16; % Cyclic prefix length modOrder =4; % QAM modulation order
Vary modOrder to show how the modulation order impacts PAPR and the bit error rate (BER).
SC-FDMA Design and Transmit Mapping
The wireless digital communications standards use SC-FDMA in the upstream link (user to base station). SC-FDMA assigns a subset of M available subcarriers to each user for transmission in an OFDM symbol.
Before OFDM modulation, a DFT precodes the input data. The DFT outputs map to the OFDM subcarrier grid in one of two ways:
Localized mapping, where the data are arranged in consecutive subcarriers
Distributed (interleaved) mapping, where the data are spread L subcarriers apart for improved frequency diversity

Use L=1 for localized mapping. Otherwise, choose a value of L such that M*L < N.
% SC-FDMA parameters
M = 48;                 % Number of subcarriers
L = 1;                  % Subcarrier mapping interval (L=1 for localized)

% Create a random stream of bits, encode them in the desired baseband
% modulation, and map onto an OFDM grid
bitsPerSubcarrier = log2(modOrder);
dataIn = randi([0 1],bitsPerSubcarrier*M, numSym);      % Create a random data stream
ofdmDataGrid = qammod(dataIn,modOrder, ...              % Map the bits into the complex domain
        InputType='bit', ...
        UnitAveragePower=true);
ofdmDataGrid = cat(1,ofdmDataGrid,zeros(N-M,numSym));   % Zero-pad the unused subcarriers

% Take the same data used for OFDM, perform the DFT to precode the
% data, and form an SC-FDMA grid
scfdmaData = fft(ofdmDataGrid(1:M,:),M);                % Precode the data in the M subcarriers

% Map the precoded data via localized (L=1) or distributed (other L) mapping
scfdmaDataGrid = zeros(N,numSym);
scfdmaDataGrid(1:L:M*L,:) = scfdmaData;
OFDM Modulation
Modulate the uncoded input and the precoded input to create the OFDM and SC-FDMA signals, respectively. Note that both signals are modulated using the same OFDM modulation parameters, so that only the precoding distinguishes SC-FDMA from OFDM.
% Modulate with OFDM
xOFDM    = ofdmmod(ofdmDataGrid,N,cpLen,OversamplingFactor=osf);
xSCFDMA  = ofdmmod(scfdmaDataGrid,N,cpLen,OversamplingFactor=osf);
PAPR Measurements
The Complimentary Cumulative Distribution Function (CCDF) computes the probability that the PAPR is higher than a reference power. Plot the CCDF of each transmitter output to show the differences between OFDM and SC-FDMA PAPR.
% Normalize the signal powers so that the average power is the same for
% both signals when comparing PAPR
pwrOFDM = sum(abs(xOFDM))/length(xOFDM);
pwrSCFDMA = sum(abs(xSCFDMA))/length(xSCFDMA);

% Compute and plot the CCDF
pm = powermeter(ComputeCCDF=true,Measurement="Peak-to-average power ratio");
paprs = pm([xOFDM/pwrOFDM xSCFDMA/pwrSCFDMA]);

plotCCDF(pm);
legend('OFDM','SC-FDMA');

disp(['The PAPR for OFDM is ' num2str(paprs(1)) ' dB']);
The PAPR for OFDM is 11.1869 dB
disp(['The PAPR for SC-FDMA is ' num2str(paprs(2)) ' dB']);
The PAPR for SC-FDMA is 8.0823 dB
disp(['The improvement in PAPR from OFDM to SC-FDMA is ' num2str(paprs(1)-paprs(2)) ' dB']);
The improvement in PAPR from OFDM to SC-FDMA is 3.1045 dB
The CCDF for the default example parameters shows that OFDM has a 10e-5 percent probability that the output signal will exceed the average power by 11.2 dB, while SC-FDMA has only a 8.0 dB PAPR at the same probability. Likewise, the OFDM signal will exceed 6.5 dB of the average power 1% of the time, vs. 0.01% of the time for SC-FDMA.
SC-FDMA Receiver
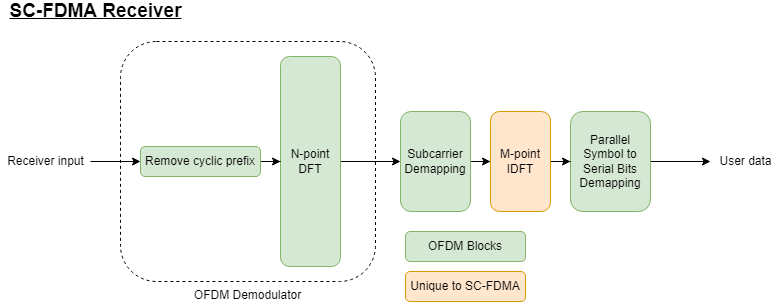
The SC-FDMA receiver is the inverse of the transmitter, with OFDM demodulation followed by an inverse DFT applied to the SC-FDMA subcarriers.

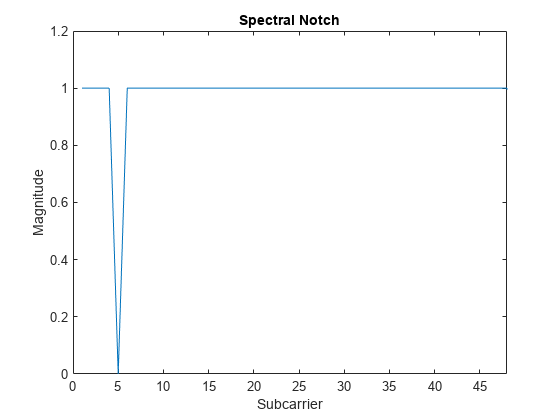
To demonstrate resiliency against frequency-selective fading, null the fifth subcarrier of the OFDM demodulator output, despread the SC-FDMA signal, decode the signal, and then compute the BER of both OFDM and SC-FDMA signals.
% Demodulate using OFDM
yOFDM   = ofdmdemod(xOFDM,N,cpLen,OversamplingFactor=osf);
ySCFDMA = ofdmdemod(xSCFDMA,N,cpLen,OversamplingFactor=osf);

% Simulate a notch in the spectrum by nulling the 5th subcarrier
yOFDM(5,:)       = 0;
ySCFDMA(5*L+1,:) = 0;
figure;
plot(abs(yOFDM));
xlim([0 M]);
title('Spectral Notch');
xlabel('Subcarrier');
ylabel('Magnitude');

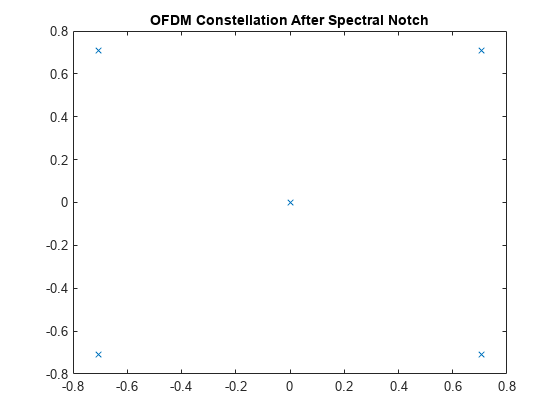
Show the effect of a frequency null on the received constellation of the OFDM signal.
figure;
plot(yOFDM(:),'x');
title('OFDM Constellation After Spectral Notch');

While the OFDM constellation is clean, the notched subcarrier creates a subcarrier with no energy, which appears as a constellation point at (0,0).
% Despread the SC-FDMA subcarriers
sSCFDMA = ifft(ySCFDMA(1:L:M*L,:),M);
Show the effect of a frequency null on the received constellation of the SC-FDMA signal. Try varying the modulation index and observe the BER as the number of bits per symbol increases.
figure;
plot(sSCFDMA(:),'x');
title('SC-FDMA Constellation After Spectral Notch');

The effect of the frequency notch has spread across the SC-FDMA subcarriers due to the IDFT operation after the OFDM demodulation, rather than concentrating on a single subcarrier as in OFDM. While the constellation is noisier than OFDM, all subcarriers retain energy, and the original signal can be decoded without error.
Decode the two signals and compute the bit error rates.
% Hard decision decoding
decOFDM   = qamdemod(yOFDM(1:M,:), modOrder, OutputType='bit',UnitAveragePower=true);
decSCFDMA = qamdemod(sSCFDMA, modOrder, OutputType='bit',UnitAveragePower=true);

% BER of notched signal
BER = comm.ErrorRate(ResetInputPort=true);
berOFDM   = BER(dataIn(:),decOFDM(:),true);
berSCFDMA = BER(dataIn(:),decSCFDMA(:),true);

disp(['BER for OFDM with spectral null = ' num2str(berOFDM(1))]);
BER for OFDM with spectral null = 0.010425
disp(['BER for SC-FDMA with spectral null = ' num2str(berSCFDMA(1))]);BER for SC-FDMA with spectral null = 0
Clearly, nulling a subcarrier of the OFDM signal creates an irrecoverable BER. However, SC-FDMA spreads the input data over M subcarriers, so nulling one of the M SC-FDMA subcarriers does not directly affect the entire user signal. Instead, it effectively creates impulse noise on the spread signal.
Conclusions
This example shows how to implement SC-FDMA transmission by adding a DFT operation before OFDM modulation and performing the inverse operation for SC-FDMA reception. The powermeter function calculates the CCDF curve and PAPR for both modulations to show the improved power distribution of SC-FDMA over OFDM. BER analysis shows that frequency-selective fading is robust with placement of a spectral null for SC-FDMA.
The lower PAPR makes SC-FDMA suitable for mobile devices because the reduced probability of nonlinear distortion allows for low-cost RF power amplifiers. Also, amplifier power consumption is lower because the power back-off can be smaller than that needed for OFDM to avoid saturation.
The table below shows other PAPR values for different values of FFT length, number of input subcarriers, and modulation types. CP length is 1/16 of the FFT length.

In general, higher values of M (the number of modulated subcarriers) yields higher PAPR, reflecting the law of large numbers in contributing to the higher peak probabilities when combining many sinusoids with different phases. A higher modulation index tends to reduce the PAPR advantage of SC-FDMA over OFDM.
References
[1] 3GPP TR 25.141 V7.0.0 "Physical layer aspects for evolved Universal Terrestrial Radio Access (UTRA)." 3rd Generation Partnership Project; Technical Specification Group Radio Access Network.
[2] 3GPP TS 38.211. “NR; Physical channels and modulation.” 3rd Generation Partnership Project; Technical Specification Group Radio Access Network.
[3] Tervo, Oskari, Ilmari Nousiainen, Ismael Peruga Nasarre, Esa Tiirola, and Jari Hulkkonen. “On the Potential of Using Sub-THz Frequencies for Beyond 5G.” In 2022 Joint European Conference on Networks and Communications & 6G Summit (EuCNC/6G Summit), 37–42. Grenoble, France: IEEE, 2022.