mssgolay
Smooth signal with peaks using least-squares polynomial
Syntax
Description
mssgolay(
smooths raw noisy signal data, X,Intensities)Intensities, using a least-squares
digital polynomial filter (Savitzky and Golay filters) and plots the result. The default
span or frame is 15 samples.
Use mssgolay with data from any separation technique that produces
signal data, such as spectroscopy, NMR, electrophoresis, chromatography, or mass
spectrometry.
Yout = mssgolay(X,Intensities)Yout. This syntax does not plot the
data.
Yout = mssgolay(X,Intensities,Name=Value)
Examples
This example shows how to smooth mass spectrometry data using least-squares polynomial approach.
Load a MAT-file, included with Bioinformatics Toolbox™, that contains mass spectrometry data including MZ_lo_res , a vector of m/z values for a set of spectra, and Y_lo_res , a matrix of intensity values for a set of mass spectra that share the same m/z charge.
load sample_lo_resApply least-squares polynomial smoothing to the data.
YS = mssgolay(MZ_lo_res,Y_lo_res);
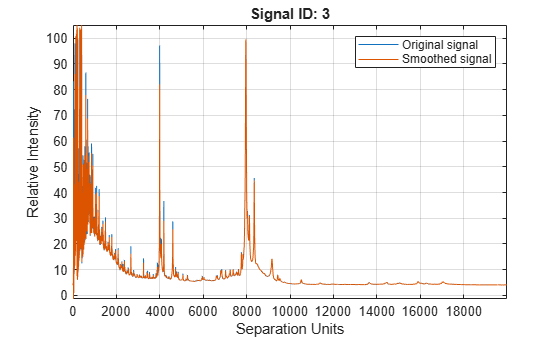
Plot the third sample/spectrogram in Y_lo_res , and its smoothed signal.
mssgolay(MZ_lo_res,Y_lo_res,ShowPlot=3);
Input Arguments
Name-Value Arguments
Output Arguments
Tips
The original algorithm by Savitzky and Golay assumes the input vector,
X, has uniformly spaced separation units, whilemssgolayalso allows one that is not uniformly spaced. Therefore, the sliding frame for smoothing is centered using the closest samples in terms of theXvalue and not in terms of theXindex.When the input vector,
X, does not have repeated values orNaNvalues, the algorithm is approximately twice as fast.When the input vector,
X, is evenly spaced, the least-squares fitting is performed once so that the signal is filtered with the same coefficients, and the speed of the algorithm increases considerably.If the input vector,
X, is evenly spaced and theSpanvalue is even, span is incremented by1to include both edge samples in the frame.
Version History
Introduced before R2006a
See Also
mspalign | msbackadj | msdotplot | msalign | msheatmap | mslowess | msnorm | mspeaks | msresample | msppresample | msviewer
Topics
- Mass Spectrometry and Bioanalytics
- Preprocessing Raw Mass Spectrometry Data
- Visualizing and Preprocessing Hyphenated Mass Spectrometry Data Sets for Metabolite and Protein/Peptide Profiling
- Differential Analysis of Complex Protein and Metabolite Mixtures Using Liquid Chromatography/Mass Spectrometry (LC/MS)