Main Content

mafdr

Estimate positive false discovery rate for multiple hypothesis testing

Description

example

FDR = mafdr(PValues) returns FDR that contains a positive false discovery rate (pFDR) for each entry in PValues using the procedure introduced by Storey (2002) [1]. PValues contains one p-value for each feature (for example, a gene) in a data set.

example

FDR = mafdr(PValues,Name,Value) uses additional options specified by one or more name-value pair arguments. For example, 'Showplot',true displays diagnostic plots of calculated results.

example

[FDR,Q] = mafdr(PValues,___) also returns hypothesis testing error measures Q for all p-values. Optionally, you can specify one or more name-value pair arguments.

example

[FDR,Q,aPrioriProb] = mafdr(PValues,___) also returns aPrioriProb, the estimated a priori probability that the null hypothesis π^0 is true.

example

[FDR,Q,aPrioriProb,R_squared] = mafdr(PValues,'Method','polynomial',___) also returns R_squared, the square of correlation coefficient. Use the polynomial method to get the R-squared value.

Examples

collapse all

Estimate the positive FDR using data from a prostate cancer study (Best et al., 2005). The data contains probe intensity data from Affymetrix® HG-U133A GeneChip® arrays.

Load the gene expression data. It contains two variables, dependentData and independentData that are two matrices of gene expression values from two experimental conditions.

load prostatecancerexpdata

Use mattest to calculate the p-values for gene expression values in the two matrices.

pvalues = mattest(dependentData,independentData,'permute',true);

Use mafdr to calculate the positive FDR values.

fdr = mafdr(pvalues);

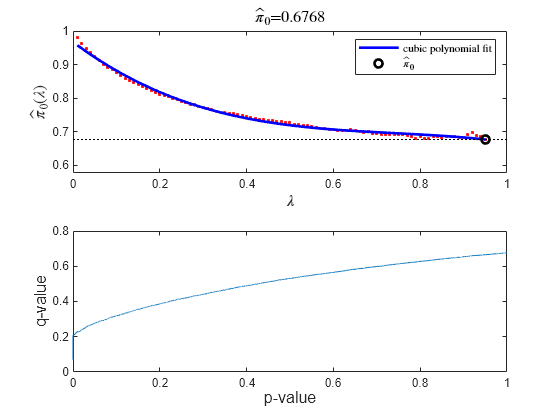
Calculate the q-values, a priori probability (that the null hypothesis is true), and R-squared value. You must use the polynomial method to get the R-squared value. Plot the data by setting 'Showplot' to true.

[fdr,q,priori,R2] = mafdr(pvalues,'Method','polynomial','Showplot',true);

Figure contains 2 axes objects. Axes object 1 with title pi toThePowerOf circumflex baseline indexOf 0 baseline =0.6768, xlabel $\lambda$, ylabel $\hat\pi_0(\lambda)$ contains 4 objects of type line. One or more of the lines displays its values using only markers These objects represent cubic polynomial fit, $\hat\pi_0$. Axes object 2 with xlabel p-value, ylabel q-value contains an object of type line.

Input Arguments

collapse all

P-values for all features in a data set, specified as a column vector or a DataMatrix object. You can use the first output of the mattest function.

Data Types: double

Name-Value Arguments

Specify optional pairs of arguments as Name1=Value1,...,NameN=ValueN, where Name is the argument name and Value is the corresponding value. Name-value arguments must appear after other arguments, but the order of the pairs does not matter.

Before R2021a, use commas to separate each name and value, and enclose Name in quotes.

Example: fdr = mafdr(pvals,'Lambda',0.5,'Showplot',true) specifies the tuning parameter value of 0.5 to estimate a prior probability and displays the quality statistics plots.

Flag to use the linear step-up procedure introduced by Benjamini and Hochberg (1995) [2], specified as the comma-separated pair consisting of 'BHFDR' and true or false. The default value is false, that is, the function uses the procedure introduced by Storey (2002) [1].

If true:

  • The function uses the Benjamini and Hochberg method.

  • The function ignores the 'Method' and 'Lambda' name-value pair arguments.

  • Specify only one output argument, that is, FDR.

  • If you also set 'Showplot' to true, then the function plots only the q-values versus p-values. For details, see Showplot.

Example: 'BHFDR',true

Data Types: logical

Tuning parameter used to estimate the a priori probability that the null hypothesis is true, specified as the comma-separated pair consisting of 'Lambda' and a positive scalar or vector with four or more values. The scalar value or each value in the vector must be between 0 and 1.

  • If you specify a single value, then the function ignores the 'Method' name-value pair argument.

  • If you specify a vector of values, then the function chooses the optimal value using the method specified by the 'Method' name-value pair argument.

Example: 'Lambda'[0.01:0.1:0.95]

Data Types: double

Method to choose the Lambda value from a range of values, specified as the comma-separated pair consisting of 'Method' and 'bootstrap' or 'polynomial'.

Example: 'Method','polynomial'

Data Types: char | string

Flag to display two diagnostic plots, specified as the comma-separated pair consisting of 'Showplot' and true or false.

If true, the function displays two plots:

  • Estimated a priori probability that the null hypothesis π^0(λ) is true versus the tuning parameter (λ) with a cubic polynomial fitting curve

  • q-values versus p-values

If you also set 'BHFDR' to true, the function displays only the second plot.

Example: 'Showplot',true

Data Types: logical

Output Arguments

collapse all

Positive FDR values, returned as a vector or DataMatrix object.

If PValues is a column vector, then FDR is a column vector.

If PValues is a DataMatrix object, then FDR is a DataMatrix object.

Q-values, returned as a column vector. Q contains the measures of hypothesis testing error for all observations in PValues.

Estimated a priori probability that the null hypothesis π^0 is true, returned as a positive scalar.

Square of the correlation coefficient, returned as a positive scalar. Specify 'Method' as 'polynomial' to get this fourth output.

References

[1] Storey, John D. “A Direct Approach to False Discovery Rates.” Journal of the Royal Statistical Society: Series B (Statistical Methodology) 64, no. 3 (August 2002): 479–98.

[2] Benjamini, Y., and Hochberg, Y. 1995. Controlling the false discovery rate: A practical and powerful approach to multiple testing. J. Royal Stat. Soc. 57:289–300.

[3] Best, C.J.M., Gillespie, J.W., Yi, Y., Chandramouli, G.V.R., Perlmutter, M.A., Gathright, Y., Erickson, H.S., Georgevich, L., Tangrea, M.A., Duray, P.H., Gonzalez, S., Velasco, A., Linehan, W.M., Matusik, R.J., Price, D.K., Figg, W.D., Emmert-Buck, M.R., and Chuaqui, R.F. 2005. Molecular alterations in primary prostate cancer after androgen ablation therapy. Clin. Cancer Res. 11:6823–6831.

[4] Storey, J.D., and Tibshirani, R. 2003. Statistical significance for genomewide studies. Proc. Nat. Acad. Sci. 100:9440–9445.

[5] Storey, J.D., Taylor, J.E., and Siegmund, D. 2004. Strong control, conservative point estimation and simultaneous conservative consistency of false discovery rates: A unified approach. J. Royal Stat. Soc. 66:187–205.

Version History

Introduced in R2007a