HeatMap
Object containing matrix and heatmap display properties
Description
The HeatMap function creates a HeatMap
object. You can use the object to display a heatmap (2-D color image) of matrix
data.
Creation
Description
hmObj = HeatMap(
displays a heatmap (2-D color image) of data)data and returns an object
containing the data and display properties.
hmObj =
HeatMap(
sets the object properties using
name-value pairs. For example, data,Name,Value)HeatMap(data,'Annotate',true) displays
data values in the heatmap. You can specify multiple name-value pairs. Enclose each
property name in quotes.
Input Arguments
Heatmap data, specified as a DataMatrix object or numeric matrix.
Name-Value Arguments
Use comma-separated name-value pair arguments to set the object properties. Enclose each property name in single quotes.
Example: hm =
HeatMap(data,'Colormap',redbluecmap,'Annotate',true)
Properties
Dimension for standardizing data values, specified as a character vector, string, or positive integer. Choices are:
'column'or1— Standardize along the columns of data.'row'or2— Standardize along the rows of data.'none'or3— Do not standardize.
If you specify 'column' or 'row', the function transforms the standardized values so that the mean is 0 and the standard deviation is 1 in the specified dimension.
Example: 'column'
Data Types: double | char | string
Flag to make the heatmap color scale symmetric around zero, specified as
true or false.
Example: false
Data Types: logical
Display range of standardize values, specified as a positive scalar. The default is
the maximum absolute value in the input data.
For example, if you specify 3, there is a color variation for
values between -3 and 3, but values greater than
3 are the same color as 3, and values less than
-3 are the same color as -3.
For example, if you specify redgreencmap for the
'Colormap' property, pure red represents values greater than or
equal to the specified display range value and pure green represents values less than or
equal to the negative of the specified display range value.
Example:
3
Data Types: double
heatmap colors, specified as a three-column (M-by-3) matrix of
red-green-blue (RGB) values or the name of a function handle that returns a colormap,
such as redgreencmap or redbluecmap.
The default colormap is redgreencmap, in which red represents
values above the mean, black represents the mean, and green represents values below the
mean of a row (gene) across all columns (samples).
Example: redbluecmap
Data Types: double | char
Name of a function or function handle to impute missing data, specified as a character vector or cell array. If you specify a cell array, the first element must be the name of a function or function handle, and the remaining elements must be name-value pairs used as inputs to the function. Missing data points are colored gray in the heatmap.
If data points are missing, you can use this property to impute the missing values.
Example: 'func1'
Data Types: char
Column labels, specified as a string vector, cell array of character vectors, or
numeric vector. The size of the vector must match the number of columns in the input
data.
Example: ["sample1","sample2","sample3"]
Data Types: double | string | cell
Row labels, specified as a string vector, cell array of character vectors, or
numeric vector. The size of the vector must match the number of rows in the input
data.
Example: ["gene1","gene2","gene3"]
Data Types: double | string | cell
Orientation of column labels, specified as a numeric scalar. Specify the value of rotation in degrees (positive angles cause counterclockwise rotation).
Example: 30
Data Types: double
Orientation of row labels, specified as a numeric scalar. Specify the value of rotation in degrees (positive angles cause counterclockwise rotation).
Example: 30
Data Types: double
Flag to display data values in the heatmap, specified as true or false.
Example: true
Data Types: logical
Display precision of data values in the heatmap, specified as a numeric scalar. The default number of digits of precision is 2.
Example: 3
Data Types: double
Text color of displayed data values in the heatmap, specified as a character vector,
string, or three-element numeric vector. For example, to use cyan, you can enter
[0 1 1], 'c', "c",
"cyan", or 'cyan'. For details, see Color Options.
Example: 'red'
Data Types: char | string | double
Warning
This property will be removed in a future release. Set
LabelsWithMarkers to true for colored
markers instead of colored texts.
Color information for column labels, specified as a structure or structure array.
For a single structure, you must specify the following fields:
Labels— Cell array of character vectors specifying column labels listed in theColumnLabelsproperty.Colors— Character vector or string specifying a color for the column labels. If this field is empty, the default color (black) is used.
For a structure array, you must specify a single element in each field for each structure.
Labels— Character vector or string specifying a column label listed in theColumnLabelsproperty.Colors— Character vector or string specifying a color for the column labels. If this field is empty, the default color (black) is used.
For more information on specifying colors, see Color Options.
Data Types: struct
Warning
This property will be removed in a future release. Set
LabelsWithMarkers to true for colored
markers instead of colored texts.
Color information for row labels, specified as a structure or structure array.
For a single structure, it must have following fields.
Labels– Cell array of character vectors specifying row labels listed in theRowLabelsproperty.Colors– Character vector or string specifying a color for the row labels. If this field is empty, the default color (black) is used.
For a structure array, each structure must have a single element in each field.
Labels– Character vector or string specifying a row label listed in theRowLabelsproperty.Colors– Character vector or string specifying a color for the row labels. If this field is empty, the default color (black) is used.
For more information on specifying colors, see Color Options.
Flag to display colored markers instead of colored text for the row and column labels,
specified as true or false.
Example: true
Data Types: logical
Object Functions
Examples
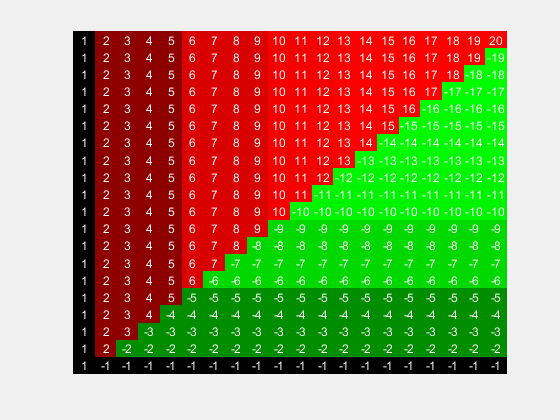
Create a matrix of data.
data = gallery('invhess',20);Display a 2-D color heatmap of the data.
hmo = HeatMap(data);
             Standardize: '[column | row | {none}]'
               Symmetric: '[true | false].'
            DisplayRange: 'Scalar.'
                Colormap: []
               ImputeFun: 'string -or- function handle -or- cell array'
            ColumnLabels: 'Cell array of strings, or an empty cell array'
               RowLabels: 'Cell array of strings, or an empty cell array'
      ColumnLabelsRotate: []
         RowLabelsRotate: []
                Annotate: '[on | {off}]'
          AnnotPrecision: []
              AnnotColor: []
       ColumnLabelsColor: 'A structure array.'
          RowLabelsColor: 'A structure array.'
       LabelsWithMarkers: '[true | false].'
    ColumnLabelsLocation: '[ top | {bottom} ]'
       RowLabelsLocation: '[ {left} | right ]'

Display the data values in the heatmap.
hmo.Annotate = true;
view(hmo)
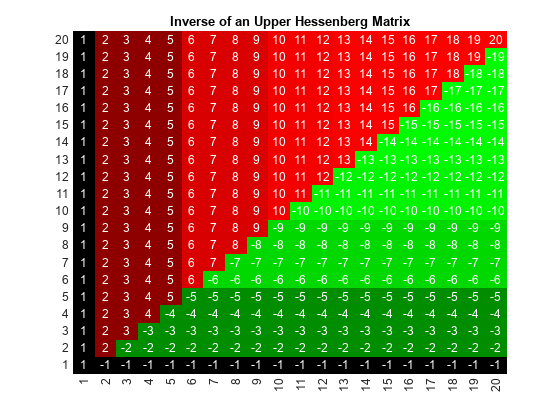
Use the plot function to display the heatmap in another figure specified by the figure handle fH.
fH = figure;
hA = plot(hmo,fH);

Use the returned axes handle hA to specify the axes properties.
hA.Title.String = 'Inverse of an Upper Hessenberg Matrix';
hA.XTickLabelMode = 'auto';
hA.YTickLabelMode = 'auto';
Load a sample of gene expression data.
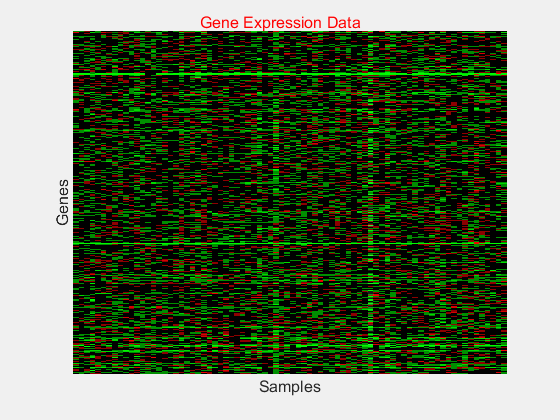
load bc_train_filteredDisplay a heatmap of the gene expression values for 4918 genes from 78 samples.
hmo = HeatMap(bcTrainData.Log10Ratio);
             Standardize: '[column | row | {none}]'
               Symmetric: '[true | false].'
            DisplayRange: 'Scalar.'
                Colormap: []
               ImputeFun: 'string -or- function handle -or- cell array'
            ColumnLabels: 'Cell array of strings, or an empty cell array'
               RowLabels: 'Cell array of strings, or an empty cell array'
      ColumnLabelsRotate: []
         RowLabelsRotate: []
                Annotate: '[on | {off}]'
          AnnotPrecision: []
              AnnotColor: []
       ColumnLabelsColor: 'A structure array.'
          RowLabelsColor: 'A structure array.'
       LabelsWithMarkers: '[true | false].'
    ColumnLabelsLocation: '[ top | {bottom} ]'
       RowLabelsLocation: '[ {left} | right ]'

Add a title to the heatmap in red.
title = addTitle(hmo,'Gene Expression Data','Color','red');
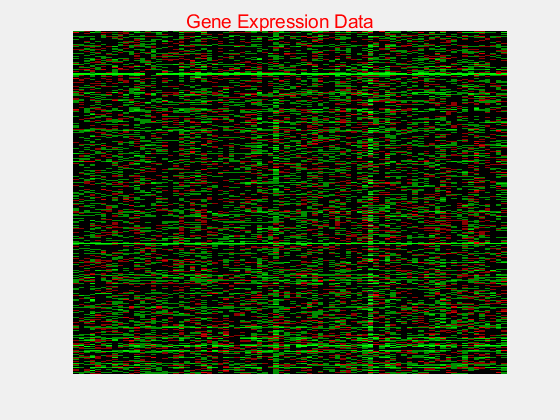
Change the title font size.
title.FontSize = 12;
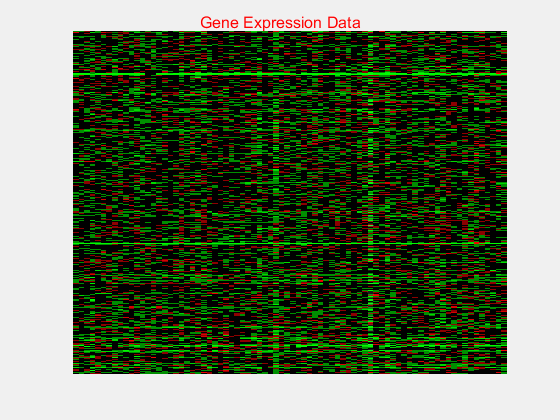
Add labels to the x-axis and y-axis.
addXLabel(hmo,'Samples','FontSize',12);
addYLabel(hmo,'Genes','FontSize',12);
More About
The following lists the predefined colors and their RGB triplet equivalents. The short names and long names are character vectors that specify one of eight preset colors. The RGB triplet is a three-element row vector whose elements specify the intensities of the red, green, and blue components of the color; the intensities must be in the range [0 1].
RGB Triplet | Short Name | Long Name |
|---|---|---|
|
|
|
|
|
|
|
|
|
|
|
|
|
|
|
|
|
|
|
|
|
|
|
|
Version History
Introduced in R2009b
See Also
MATLAB Command
You clicked a link that corresponds to this MATLAB command:
Run the command by entering it in the MATLAB Command Window. Web browsers do not support MATLAB commands.
웹사이트 선택
번역된 콘텐츠를 보고 지역별 이벤트와 혜택을 살펴보려면 웹사이트를 선택하십시오. 현재 계신 지역에 따라 다음 웹사이트를 권장합니다:
또한 다음 목록에서 웹사이트를 선택하실 수도 있습니다.
사이트 성능 최적화 방법
최고의 사이트 성능을 위해 중국 사이트(중국어 또는 영어)를 선택하십시오. 현재 계신 지역에서는 다른 국가의 MathWorks 사이트 방문이 최적화되지 않았습니다.
미주
- América Latina (Español)
- Canada (English)
- United States (English)
유럽
- Belgium (English)
- Denmark (English)
- Deutschland (Deutsch)
- España (Español)
- Finland (English)
- France (Français)
- Ireland (English)
- Italia (Italiano)
- Luxembourg (English)
- Netherlands (English)
- Norway (English)
- Österreich (Deutsch)
- Portugal (English)
- Sweden (English)
- Switzerland
- United Kingdom (English)