주요 콘텐츠

plotDriveCycles

R2026b

Plot generated RDE drive cycles

Since R2024b

    Description

    plotDriveCycles(obj) creates a figure with five tabs that display the generated Real Driving Emissions (RDE) drive cycles and their compliance with regulatory boundary conditions.

    The tabs in the generated plots are:

    • RDE — Velocity versus time for each trip, with urban-rural and rural-motorway speed boundaries shown as horizontal lines.
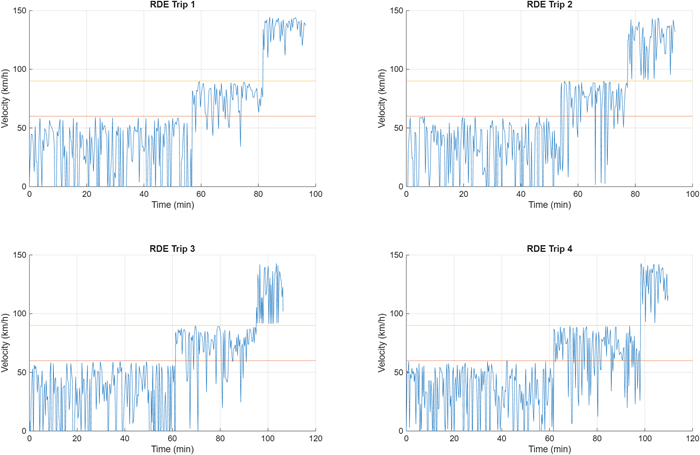
      Velocity vs. time for each generated trip, with urban/rural and rural/motorway speed boundaries shown as horizontal lines

    • Histogram — Velocity distribution histogram for each trip.
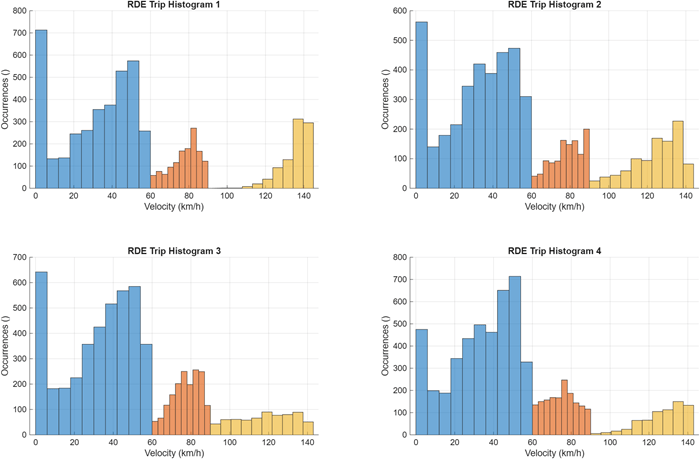
      Velocity distribution histogram for each trip

    • Acc — Velocity-acceleration scatter plot for each trip.
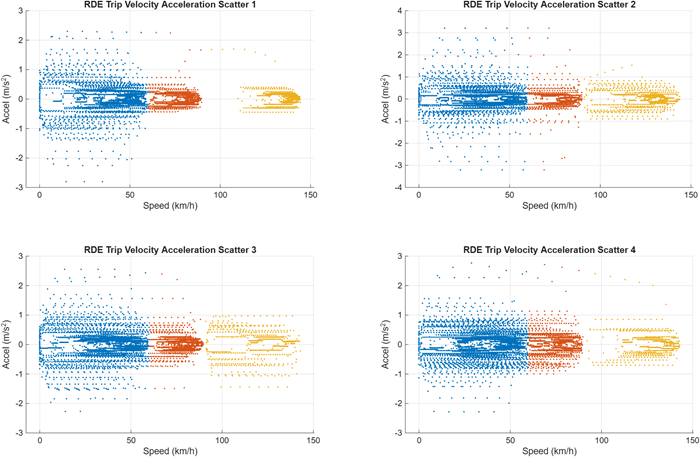
      Velocity-acceleration scatter plot for each trip

    • VA95 condition — High dynamic boundary condition verification plot showing VA95 values relative to the regulatory boundary line. VA95 is the 95th percentile of the product of vehicle speed and positive acceleration greater than 0.1 m/s^2. VA95 has units of m^2/s^3 or W/kg, similar to a power-to-mass ratio (95th percentile of v*a_pos).
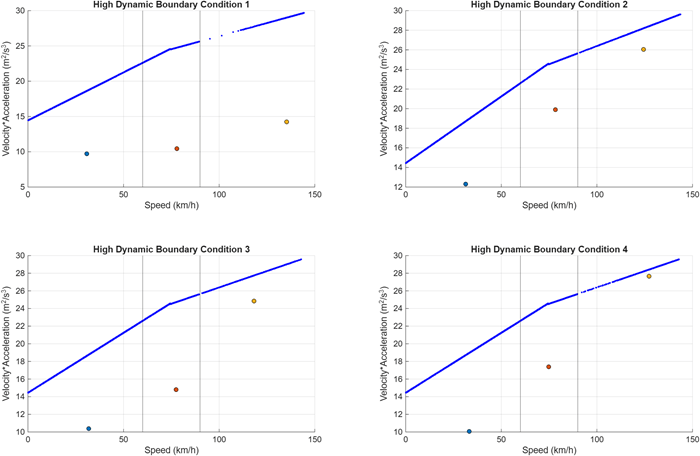
      High dynamic boundary condition (95th percentile of v*a_pos) verification plot showing VA95 values relative to the regulatory boundary line

    • RPA condition — Low dynamic boundary condition (relative positive acceleration) verification plot showing RPA values relative to the regulatory boundary line.
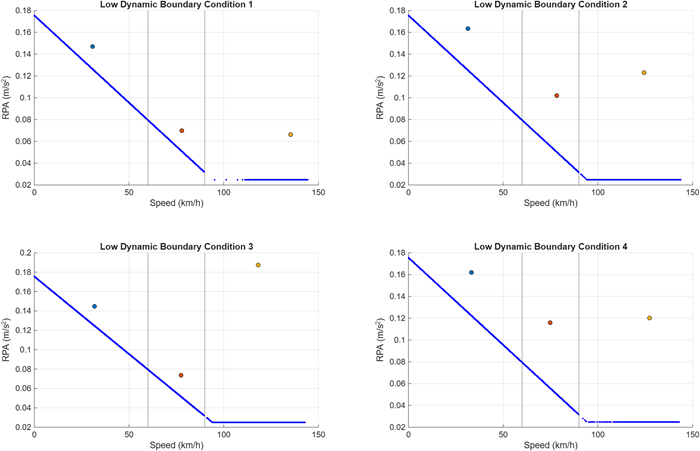
      Low dynamic boundary condition (relative positive acceleration) verification plot showing RPA values relative to the regulatory boundary line

    Note

    Every property must be set before calling generateDriveCycles. Otherwise, the function returns an "Index exceeds array bounds" error.

    example

    Examples

    collapse all

    Generate RDE trips and visualize the results.

    You must call generateDriveCycles before calling the plotDriveCycles function.

    DriveCycles = RDE.DriveCycles;
    
    % Trip Structure (speed bins: urban <=60, rural 60-90, motorway >90 km/h)
    DriveCycles.dt = 1;
    DriveCycles.StopSpeedTh = 1/3.6;
    DriveCycles.OperationModeBoundaries = [60 90]/3.6;
    
    % Distance Composition (fraction of total trip distance per segment)
    DriveCycles.UrbanRatioRange = [0.29 0.44];
    DriveCycles.RuralRatioRange = [0.23 0.43];
    DriveCycles.MotorwayRatioRange = [0.23 0.43];
    
    % Speed Constraints (average and limit speeds per segment)
    DriveCycles.MotorwayUsualMaxSpeed = 145/3.6;
    DriveCycles.MotorwayAbsoluteSpeedTimeRatio = 0.03;
    DriveCycles.MotorwayAbsoluteMaxSpeed = 160/3.6;
    DriveCycles.UrbanAverageSpeedRange = [15 40]/3.6;
    DriveCycles.RuralAverageSpeedRange = [60 90]/3.6;
    DriveCycles.MotorwayAverageSpeedRange = [90 145]/3.6;
    DriveCycles.MotorwayUsualMinSpeed = 100/3.6;
    DriveCycles.MotorwayUsualMinSpeedTime = 5*60;
    
    % Urban Stop Conditions (stop = speed <= StopSpeedTh)
    DriveCycles.UrbanStopRatioRange = [0.06 0.3];
    DriveCycles.UrbanMinStopTime = 10;
    DriveCycles.UrbanMinStopCount = 2;
    
    % Trip Duration and Distance (90-120 min, >=16 km per segment)
    DriveCycles.TripDurationRange = [90 120]*60;
    DriveCycles.UrbanMinDistance = 16000;
    DriveCycles.RuralMinDistance = 16000;
    DriveCycles.MotorwayMinDistance = 16000;
    
    % VA95 Dynamic Boundary (upper limit - trip invalid if too aggressive)
    DriveCycles.VA95VelocityThreshold = 74.6/3.6;
    DriveCycles.VA95BoundarySpeedCoeff1 = 0.136;
    DriveCycles.VA95BoundaryBias1 = 14.44;
    DriveCycles.VA95BoundarySpeedCoeff2 = 0.0742;
    DriveCycles.VA95BoundaryBias2 = 18.966;
    
    % RPA Dynamic Boundary (lower limit - trip invalid if too passive)
    DriveCycles.RPAVelocityThreshold = 94.05/3.6;
    DriveCycles.RPABoundarySpeedCoeff = -0.0016;
    DriveCycles.RPABoundaryBias = 0.1755;
    DriveCycles.RPALowerBound = 0.025;
    
    % Generation Parameters (shape: lower = more aggressive; window: higher = smoother)
    DriveCycles.ShapeParameter = 1;
    DriveCycles.SmoothingMethod = 'rloess';
    DriveCycles.SmoothingWindowLength = 5;
    DriveCycles.NTrips = 4;
    DriveCycles.NumberOfIterations = 10000;
    DriveCycles.OutputFolder = fullfile(pwd(),'results');
    
    generateDriveCycles(DriveCycles);
    plotDriveCycles(DriveCycles)

    Input Arguments

    collapse all

    RDE drive cycle generator object, specified as an RDE.DriveCycles object. Populate the Data property by calling generateDriveCycles.

    Version History

    Introduced in R2024b