visualize
Description
visualize( displays the magnitude
response of the filter bank. You can update the plot by changing the properties of the
filterBank)filterBank object.
visualize(
visualizes the selected filters from the filter bank. filterBank,ind)
visualize(___,N= uses
n)n points to display the magnitude response. The default is 8096
points.
Examples
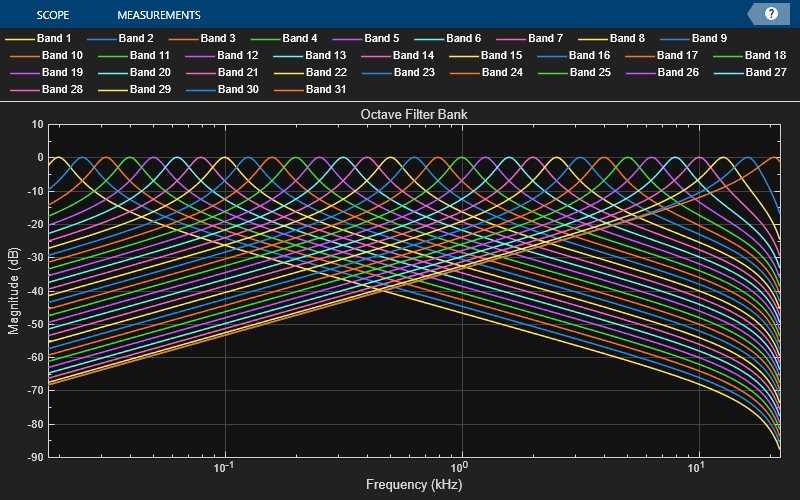
Create a 1/3-octave filter bank for a signal sampled at 48 kHz. Set the frequency range to [18 22000] Hz.
octFiltBank = octaveFilterBank("1/3 octave",48000, ...
                              FrequencyRange=[18 22000]);
Visualize the response of the filter bank.
visualize(octFiltBank)
Change the bandwidth of the filter bank from 1/3 octave to 1 octave. See how the magnitude response visualization automatically updates.
octFiltBank.Bandwidth = "1 octave";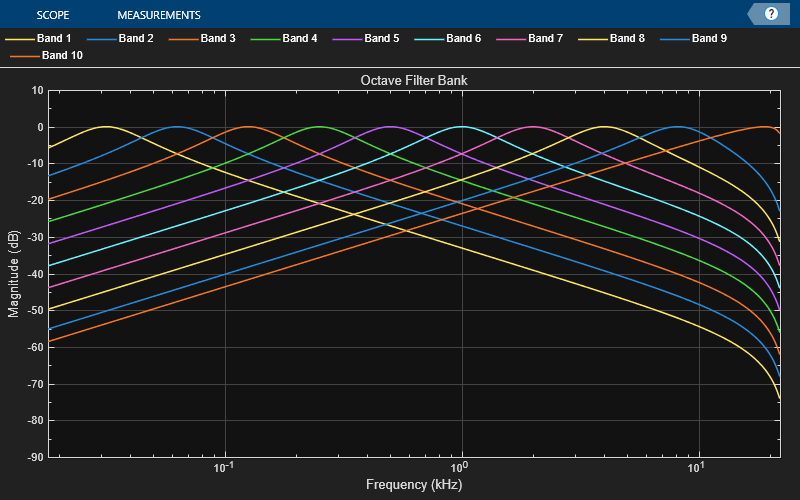
Create a default gammatone filter bank for a 16 kHz sample rate.
gammaFiltBank = gammatoneFilterBank(SampleRate=16e3);
Visualize the 3rd, 5th, and 10th filters in the filter bank.
visualize(gammaFiltBank,[3 5 10])

Visualize the same filters with only 64 points. See how the frequency resolution of the magnitude response decreases.
visualize(gammaFiltBank,[3 5 10],N=64)

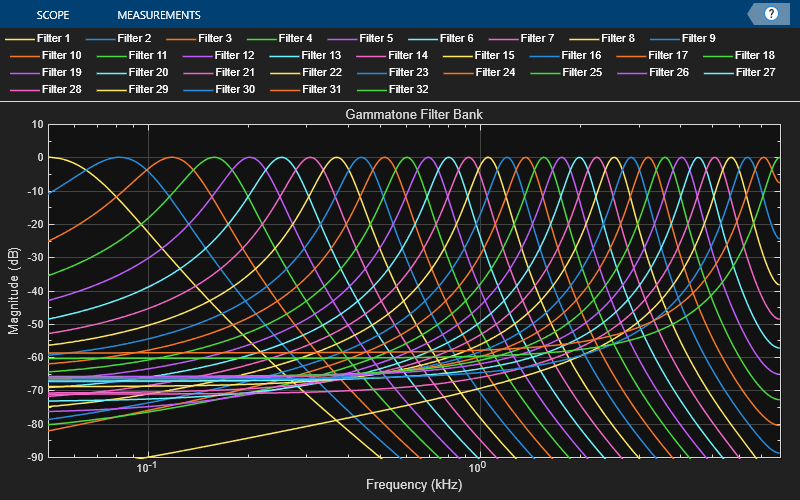
Create a default gammatone filter bank for a 16 kHz sample rate.
gammaFiltBank = gammatoneFilterBank(SampleRate=16e3);
Visualize the filter bank and get a handle to the dsp.DynamicFilterVisualizer object.
dfv = visualize(gammaFiltBank)
dfv =
  dsp.DynamicFilterVisualizer handle with properties:

      NumFrequencyPoints: 8192
     NormalizedFrequency: 0
              SampleRate: 16000
          FrequencyRange: [50 8000]
                  XScale: 'Log'
        MagnitudeDisplay: 'Magnitude (dB)'
    PlotAsMagnitudePhase: 0
             AxesScaling: 'Manual'

  Show all properties
Use the dsp.DynamicFilterVisualizer object to change properties of the filter bank plot. Set the XScale property to view the magnitude response on a linear frequency scale.
dfv.XScale = "Linear";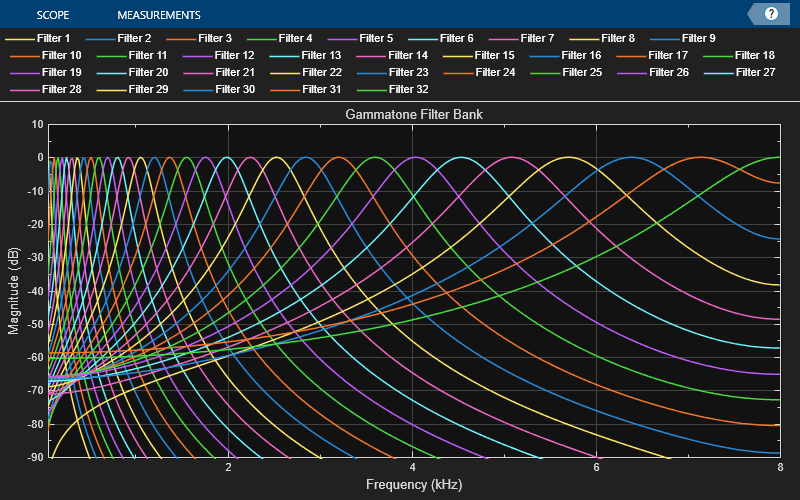
Input Arguments
Output Arguments
Version History
Introduced in R2024b