plot
Plot boundary of 2-D shape
Description
plot( plots the boundary of the
specified shape.shape)
plot(
plots the boundary of the specified shape with additional options specified by the
name-value arguments.shape,Name=Value)
p = plot(shape,Name=Value)
Examples
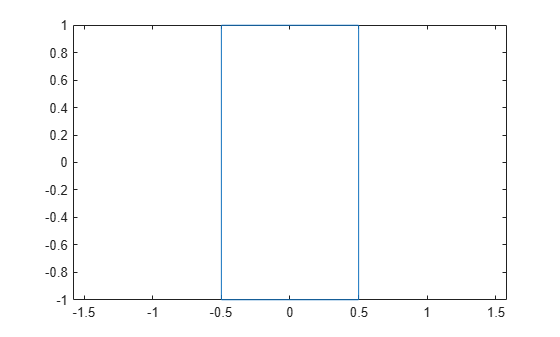
Create a rectangular shape and plot its boundary.
r = shape.Rectangle;
p = plot(r);
Input Arguments
Output Arguments
Version History
Introduced in R2017a