Baseline Fit Toolbox V. 1(20221115)
이 제출물을 팔로우합니다
- 팔로우하는 게시물 피드에서 업데이트를 확인할 수 있습니다
- 정보 수신 기본 설정에 따라 이메일을 받을 수 있습니다
This work is based on a modification of prior efforts and Edward Peltzer at the Monterey Bay Aqaurium Research Institute. Read Contents.m for full description.
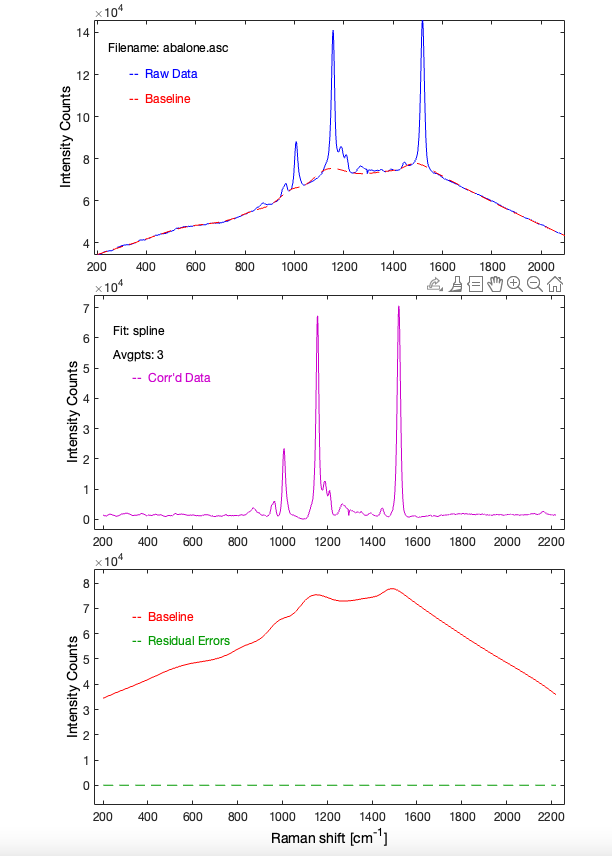
The script file was revised to display manually selected baseline points as red circles on the preview plot of the Raman spectrum. If fitted baseline is not acceptable, user is given the option to re-display the preview plot and try again. Points are not limited and do not have to be equally spaced.
User is given the option to select upper and lower intensity limits on the preview plot in order to better select the baseline points from an "intensity amplified" spectrum plot.
M-file to load 1 LRS data file and correct for fluorescence in the baseline by using the "Bfit" function to manually select and subtract the "broad" Raman shift fluorescence bands.
인용 양식
William Kirkwood (2026). Raman Baseline Correction (https://kr.mathworks.com/matlabcentral/fileexchange/120468-raman-baseline-correction), MATLAB Central File Exchange. 검색 날짜: .
도움
도움 준 파일: Raman Finder
