
There's some confusion going on here. The colors in the two images represent different things.
Let's start with the latter. You're calculating the image gradient by way of filtering all three channels of an RGB image. If the gradient within each channel is not identical (i.e. if the hue changes), then the gradient image will be colorful as well. If an edge appears red, that's because the gradient in the red channel dominates locally.
% a basic RGB gradient map
A = imread('peppers.png');
A = im2double(A);
fk = fspecial('sobel');
Ay = imfilter(A,fk);
Ax = imfilter(A,fk.');
Gm = hypot(Ax,Ay); % [0 3.54]
imshow(Gm)

As an aside, note that the range of values in Gm extends beyond the standard range for images of this class. If you were to convert this to an integer class (or do any number of other things) you might end up truncating those values unless the result is rescaled.
What about that circle image? That's a different story. This is a false color (colormapped) image representing gradient angle. Really, it's basically a meaningless image since it's provided without a colorbar or any sort of reference, and I'm pretty sure the colormapping is wrong anyway. To explore why I'm saying that, let's recreate it in a way that should actually make sense.
sz = [300 300]; % image size
c = ceil(sz/2); % center
r = 0.9*c(1); % circle radius
C = drawcircle_aa(sz,c,r);
fk = fspecial('sobel');
Cy = imfilter(C,fk);
Cx = imfilter(C,fk.');
Gm = hypot(Cx,Cy);
Ga = atan2d(Cy,Cx);
hibg = imshow(zeros([size(C) 3])); hold on
hi = imshow(Ga,[-180 180]);
hi.AlphaData = normalize(Gm,'range');
CT = hsv(256);
colormap(CT)
cb = colorbar;
cb.Ticks = [-180 -135 -90 -45 0 45 90 135 180];
cb.Position(4) = 0.9;
cb.Position(2) = 0.05;
set(gca,'position',[0 0 0.8 1])

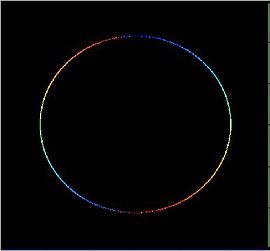
That makes sense visually. It's a solid circle. We'd expect the gradient angle around the edges to span the interval [0 360] in a single smooth cycle. If you look again at the image from Wikipedia, that's not what you see. You see two color cycles. I have a feeling that whoever made the image got their colormap scaling off by a factor of two based on glance at the maximum value of the result (due to the symmetry of the arctangent). This is basically what would end up happening:
% redraw that, but wrong
figure
hibg = imshow(zeros([size(C) 3])); hold on
hi = imshow(Ga,[-180 180]);
hi.AlphaData = normalize(Gm,'range');
CT = hsv(256);
CT = [CT; CT]; % what the wiki image probably did
colormap(CT)
cb = colorbar;
cb.Ticks = [-180 -135 -90 -45 0 45 90 135 180];
cb.Position(4) = 0.9;
cb.Position(2) = 0.05;
set(gca,'position',[0 0 0.8 1])

Disregarding the color sequence, that's basically what you wind up with. Note that once we have a colorbar, the ambiguity becomes a lot more apparent than it is without one.
Finally, how would one replicate the wiki image without having to resort to all that hassle with figure setup?
sz = [300 300]; % image size
c = ceil(sz/2); % center
r = 0.9*c(1); % circle radius
C = drawcircle_aa(sz,c,r);
fk = fspecial('sobel');
Cy = imfilter(C,fk);
Cx = imfilter(C,fk.');
Gm = hypot(Cx,Cy);
Ga = atan2d(Cy,Cx);
% construct image from parts
CT = hsv(256);
FG = normalize(Gm,'range');
BG = mat2gray(Ga,[-180 180]);
BG = gray2ind(BG,256);
BG = ind2rgb(BG,CT);
outpict = BG.*FG;
figure
imshow(outpict)

Which is a lot easier ... so long as you don't care to include the colorbar!
This is just a helper function used in the above code.
% draw smooth circle
function circ = drawcircle_aa(sz,c,r)
xx = 1:sz(2);
yy = (1:sz(1)).';
circ = sqrt((xx-c(2)).^2 + (yy-c(1)).^2);
circ = min(max(-(circ-r)/2,0),1);
end