Difficult to help unless you provide more information. For example, upload example images and describe your desired output in better detail.
how to plot slice graph from several png files
조회 수: 6 (최근 30일)
이전 댓글 표시
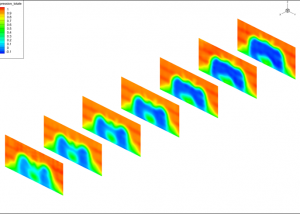
Hello Everybody I have several png files that show displacement varying with time, for a nice visualization I thought that making a slice graph could be a nice idea, I didn't find any example helping me, I would appreciate any help.Thank you
댓글 수: 3
참고 항목
Community Treasure Hunt
Find the treasures in MATLAB Central and discover how the community can help you!
Start Hunting!
Translated by ![]()
또한 다음 목록에서 웹사이트를 선택하실 수도 있습니다.
미주
- América Latina (Español)
- Canada (English)
- United States (English)
유럽
- Belgium (English)
- Denmark (English)
- Deutschland (Deutsch)
- España (Español)
- Finland (English)
- France (Français)
- Ireland (English)
- Italia (Italiano)
- Luxembourg (English)
- Netherlands (English)
- Norway (English)
- Österreich (Deutsch)
- Portugal (English)
- Sweden (English)
- Switzerland
- United Kingdom(English)
아시아 태평양
- Australia (English)
- India (English)
- New Zealand (English)
- 中国
- 日本Japanese (日本語)
- 한국Korean (한국어)