Remove and Visualize Outliers in Your Data
This example shows how to detect and remove outliers in your ThingSpeak™ channel data using a Hampel filter. This filter is closely related to a median filter, and it helps to remove outliers from a signal without overly smoothing the data.
Read Data
Read the wind speed stored in channel 22641 using the thingSpeakRead function.
data = thingSpeakRead(12397,'NumPoints',80,'Fields',2,'outputFormat','table');
Remove Outliers
Remove outliers in the raw data by applying Hampel function. Specify the window size as 6, or about three minutes of data on either side of each sample in the measurement window. This setting allows for sufficient data to decide whether each point is an outlier. Since the data is dynamic, your results may vary depending on the present weather. Specify the number of standard deviations to be 2. If a data point differs from the local median by more than this number it is replaced with the local median value.
windowSize = 6;
numMedians = 2;
[filteredData,outliers]=hampel(data.WindSpeedmph,windowSize,numMedians);
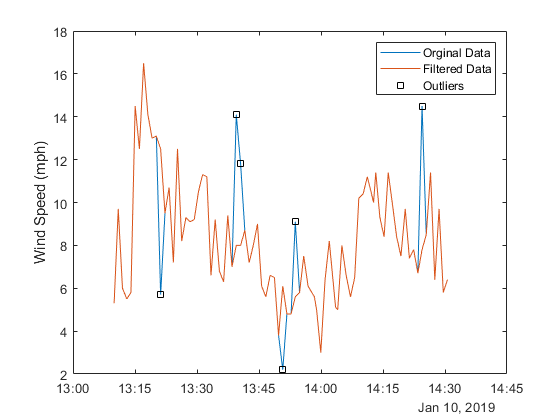
Visualize Data
Plot the original data and the filtered data. Show the outliers detected and removed.
plot(data.Timestamps,data.WindSpeedmph);
hold
plot(data.Timestamps,filteredData);
plot(data.Timestamps(outliers),data.WindSpeedmph(outliers),'Marker','Square','Linestyle','None','Color','black');
ylabel('Wind Speed (mph)');
legend('Orginal Data', 'Filtered Data','Outliers');
Current plot held
Write Data to ThingSpeak
Send the number of outliers detected to a ThingSpeak channel using the thingSpeakWrite function. Change the channelID and the writeAPIKey to send data to your channel.
channelID=17504;
writeAPIKey='23ZLGOBBU9TWHG2H';
thingSpeakWrite(channelID,sum(outliers),'WriteKey',writeAPIKey);
See Also
Functions
thingSpeakRead|hampel(Signal Processing Toolbox)