Create Heatmap Overlay Image
This example shows how to create a heatmap using wireless network signal strength measurements from an ESP32 development board.
ThingSpeak™ helps you visualize your data by projecting measurements over an image or map. You do not need special hardware, but you need an image of the area and position measurements. For more information, see Wireless Network Signal Strength with ESP32 with Arduino IDE.
Create a MATLAB Visualization
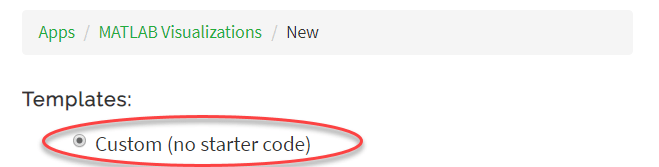
Select Apps > MATLAB Visualizations. Then select New and select select Custom (no starter code) and click Create.
Collect Data
Save the X and Y coordinates and the signal strength in separate vectors. You can read the data for signal strength from a ThingSpeak channel. Replace CHANNEL_ID, READ_API_KEY, and FIELD_NUMBER with the appropriate values from your channel. You can find your channel ID at the top of the main page for your channel. You can find the API key on the API Keys tab of your channel view.
% Enter data by hand if data from a ThingSpeak channel is not available.
strength = [-90 -90 -90 -90 -40 -20 -22.4 -45 -35 -41 -44 -55 -40 -75 -26]';
% Read data from a ThingSpeak channel.
% Uncomment the next line to read from ThingSpeak.
% strength = thingSpeakRead(CHANNEL_ID, ReadKey',READ_API_KEY,'numPoints',15,'fields',FIELD_NUMBER');
X = [10 550 550 10 50 234 393 129 237 328 448 225 344 457 477]';
Y = [10 10 410 410 293 210 202 132 130 142 141 272 268 274 200]';
Convert the wireless signal measurements into percentages.
strengthPercent = 2*(strength+100)/100;
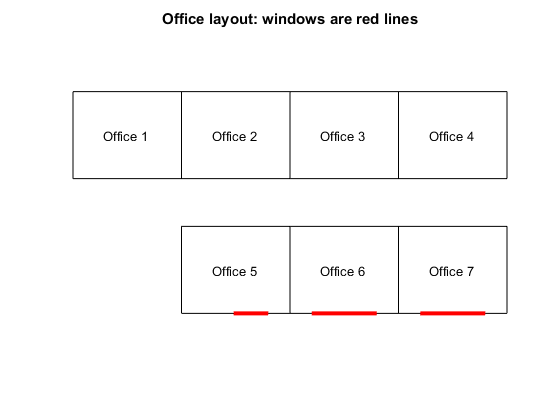
Read in the Image
Store the dimensions of the image. Your image must be hosted on the web.
[I,m] = imread('https://www.mathworks.com/help/examples/thingspeak/win64/CreateHeatmapOverlayImageTSExample_02.png','png');
picture=ind2rgb(I,m);
[height,width,depth] = size(picture);
Create a Model
Interpolate the existing points and fill the overlay image with the interpolated results. Then set the transparency for the overlay.
OverlayImage=[];
F = scatteredInterpolant(Y, X, strengthPercent,'linear');
for i = 1:height-1
   for j = 1:width-1
          OverlayImage(i,j) = F(i,j);
   end
end
alpha = (~isnan(OverlayImage))*0.4;
Show the Image and the Color Bar
Finally, show the image with the color bar. Set the color limits to be relative to the data values. Set AlphaData to be the transparency matrix created earlier.
imshow(picture,m);
hold on

h = imshow(OverlayImage);

colormap(h.Parent, jet);
colorbar(h.Parent);
set(h,'AlphaData',alpha);
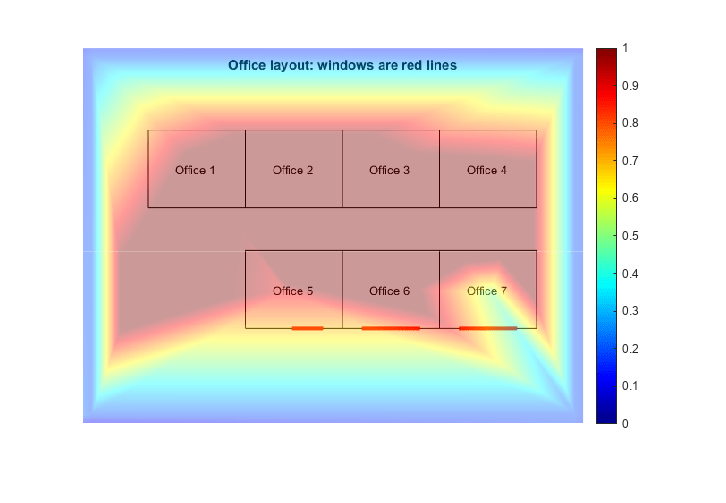
The final result indicates the areas where the signal strength is highest and lowest in red and blue, respectively.
See Also
MATLAB Analysis App | MATLAB Visualizations App | Wireless Network Signal Strength with ESP32 with Arduino IDE | Write Data | thingSpeakRead