이 번역 페이지는 최신 내용을 담고 있지 않습니다. 최신 내용을 영문으로 보려면 여기를 클릭하십시오.
분류 앙상블 훈련시키기
이 예제에서는 ionosphere 데이터 세트에 대한 분류 트리 앙상블을 만들고 이를 사용하여 평균 측정값을 기준으로 레이다 리턴값의 분류를 예측하는 방법을 보여줍니다.
ionosphere 데이터 세트를 불러옵니다.
load ionosphere분류 앙상블을 훈련시킵니다. 이진 분류 문제의 경우, fitcensemble은 LogitBoost를 사용하여 100개의 분류 트리를 집계합니다.
Mdl = fitcensemble(X,Y)
Mdl =
  ClassificationEnsemble
             ResponseName: 'Y'
    CategoricalPredictors: []
               ClassNames: {'b'  'g'}
           ScoreTransform: 'none'
          NumObservations: 351
               NumTrained: 100
                   Method: 'LogitBoost'
             LearnerNames: {'Tree'}
     ReasonForTermination: 'Terminated normally after completing the requested number of training cycles.'
                  FitInfo: [100×1 double]
       FitInfoDescription: {2×1 cell}


  Properties, Methods
Mdl은 ClassificationEnsemble 모델입니다.
앙상블에서 첫 번째로 훈련된 분류 트리의 그래프를 플로팅합니다.
view(Mdl.Trained{1}.CompactRegressionLearner,'Mode','graph');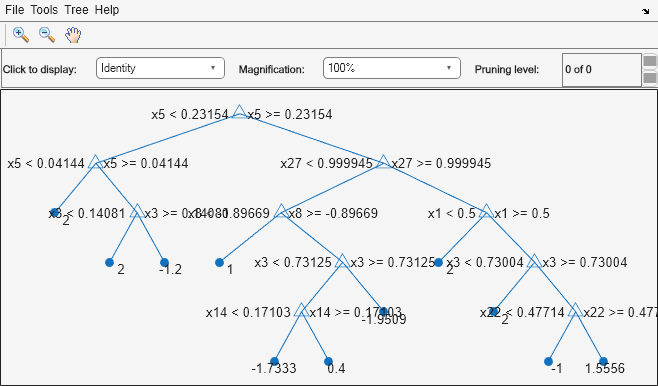
기본적으로 fitcensemble은 부스팅 알고리즘에 대한 얕은 트리를 성장시킵니다. 트리 템플릿 객체를 fitcensemble로 전달하여 트리 깊이를 변경할 수 있습니다. 자세한 내용은 templateTree 항목을 참조하십시오.
평균 예측 변수 측정값으로 레이다 리턴값의 품질을 예측합니다.
label = predict(Mdl,mean(X))
label = 1×1 cell array
    {'g'}