Main Content

multivarichart

Multivari chart for grouped data

Description

multivarichart(y,group) creates a multivari chart for the vector y with groups defined by the entries in group. Each subplot of the plot matrix contains a multivari chart for the first and second grouping variables. The x-axis in each subplot contains the values of the first grouping variable. The legend at the bottom of the figure window identifies the values of the second grouping variable. The subplot at position (i,j) is the multivari chart for the subset of y at the ith level of the third grouping variable and the jth level of the fourth grouping variable. If the third or fourth grouping variable is absent, multivarichart assumes that the variable has only one level.

example

multivarichart(Z) displays a multivari chart for the n-by-m matrix Z. The first row of Z contains data for the m values of the second grouping variable that correspond to the first value of the first grouping variable. The remaining rows of Z contain data corresponding to the other n–1 values of the first grouping variable. The first grouping variable has integer values from 1 to n, and the second grouping variable has integer values from 1 to m.

example

multivarichart(___,Name=Value) specifies options using one or more name-value arguments in addition to any of the input argument combinations in the previous syntaxes. For example, you can specify the grouping variable names and the plot order.

example

multivarichart(parent,___) plots into the figure specified by parent instead of the current figure (gcf). (since R2024a)

[h,ax]=multivarichart(___) returns graphics handles to the figure window in h and the individual plots in ax.

Examples

collapse all

Randomly generate data for a response variable y.

y = randn(100,1);

Randomly generate grouping data associated with each response. The first factor X1 has three levels, the second factor X2 has two levels, and the third factor X3 has three levels.

X1 = ceil(3*rand(100,1));
X2 = ceil(2*rand(100,1));
X3 = ceil(3*rand(100,1));
group = [X1 X2 X3]; 

Create a multivari chart for the data using the three grouping variables.

multivarichart(y,group)

Figure contains 3 axes objects. Axes object 1 with title X3 = 1, xlabel X1 contains 2 objects of type line. One or more of the lines displays its values using only markers These objects represent X2 = 1, X2 = 2. Axes object 2 with title X3 = 2, xlabel X1 contains 2 objects of type line. One or more of the lines displays its values using only markers Axes object 3 with title X3 = 3, xlabel X1 contains 2 objects of type line. One or more of the lines displays its values using only markers

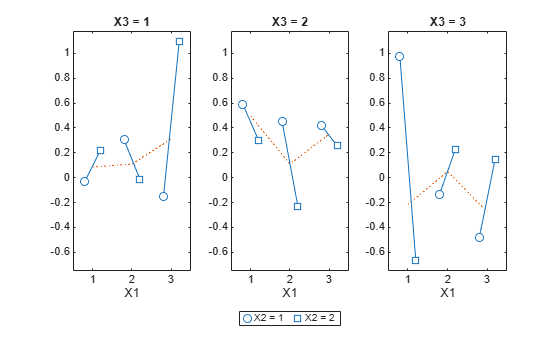
The multivari chart is a two-factor interaction plot, which plots the mean response for different values of the grouping variables X1, X2, and X3.

Randomly generate response data for two grouping variables that have integer values in the range [1,4] and [1,7], respectively.

Z = rand(4,7)
Z = 4×7

    0.8147    0.6324    0.9575    0.9572    0.4218    0.6557    0.6787
    0.9058    0.0975    0.9649    0.4854    0.9157    0.0357    0.7577
    0.1270    0.2785    0.1576    0.8003    0.7922    0.8491    0.7431
    0.9134    0.5469    0.9706    0.1419    0.9595    0.9340    0.3922

Create a multivari chart for the response data. Label the grouping variables A and B.

multivarichart(Z,VarNames=["A","B"])

Figure contains an axes object. The axes object with xlabel A contains 7 objects of type line. One or more of the lines displays its values using only markers These objects represent B = 1, B = 2, B = 3, B = 4, B = 5, B = 6, B = 7.

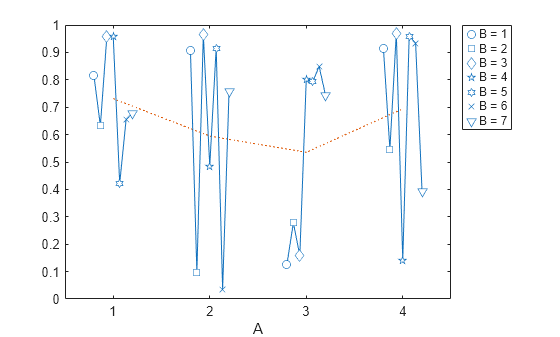
The multivari chart is a two-factor interaction plot, that shows the responses and mean response for different values of the grouping variables A and B.

Input Arguments

collapse all

Input data, specified as a numeric vector. If you specify y, you must specify group.

Data Types: single | double

Input data, specified as a numeric matrix. The data in different columns represents the changes in one factor. The data in different rows represents the changes in another factor. If you specify Z, you cannot specify group.

Data Types: single | double

Grouping variables, specified as a cell array or numeric matrix. You cannot specify group if you specify the input data Z. If group is a cell array, then each cell of group must contain a grouping variable that is a categorical variable, numeric vector, character matrix, string array, or single-column cell array of character vectors. If group is a numeric matrix, then its columns represent different grouping variables and its rows correspond to the rows in y.

Each grouping variable must have the same number of elements as y. The number of grouping variables must be 2, 3, or 4.

Example: {Smoker,Gender}

Data Types: categorical | single | double | char | string | cell

Parent container, specified as a Figure or Panel object.

Name-Value Arguments

collapse all

Specify optional pairs of arguments as Name1=Value1,...,NameN=ValueN, where Name is the argument name and Value is the corresponding value. Name-value arguments must appear after other arguments, but the order of the pairs does not matter.

Example: multivarichart(Y,group,VarNames=["Weight","MPG"}) creates a multivari chart for the vector y with groups defined in group, and grouping variables named "Weight" and "MPG".

Grouping variable names, specified as a character matrix, string array, or cell array of character vectors. If VarNames is a character matrix, it must have size(group,2) rows. Otherwise, Varnames must have size(group,2) elements. If you do not specify VarNames, the default names are "X1", "X2", ... .

Example: VarNames=["A","B","C","D"]

Data Types: char | string | cell

Plot order, specified as "sorted" or a numeric vector containing a permutation of the integers from 1 to the number of grouping variables.

If PlotOrder="sorted", the function rearranges the grouping variables in descending order according to the number of levels in each variable.

If PlotOrder is a vector,the function plots each grouping variable in the order indicated by the vector. For example, if you specify PlotOrder=[2,3,1,4], the function uses the second grouping variable for the x-axis of each subplot, the third grouping variable for the legend, the first grouping variable for the columns of the plot, and the fourth grouping variable for the rows of the plot.

Example: PlotOrder=[3 2 1]

Data Types: char | string | single | double

Output Arguments

collapse all

Handle to the figure window, returned as a figure handle.

Axes handles to the individual plots, returned as an array of Axes objects.

Version History

Introduced in R2006b

expand all