Stateflow 차트에서 가변 크기 데이터 선언하기
Simulink® 모델의 Stateflow® 차트에서 대부분의 데이터 크기는 컴파일할 때 고정되며 런타임 중에 변경되지 않습니다. 반면에, 가변 크기 데이터는 시뮬레이션 중에 크기가 변경될 수 있습니다. 예를 들어, Stateflow 차트의 출력이 차트 상태에 따라 크기가 달라지는 배열인 경우 가변 크기 데이터를 사용할 수 있습니다.
가변 크기 데이터에 대한 지원 활성화하기
기본적으로, Stateflow는 가변 크기 데이터를 지원합니다. 개별 차트에서 이 지원을 활성화하거나 비활성화하려면 차트 속성 가변 크기 배열 지원을 수정하십시오.
이 차트 속성을 활성화하면 차트는 Simulink 모델의 다른 블록으로부터 가변 크기 입력 데이터가 들어오는 것을 허용합니다. 가변 크기 데이터 객체를 추가로 선언하려면 데이터 속성 설정하기 항목의 설명과 같이 가변 크기 데이터 속성을 활성화하면 됩니다. 자세한 내용은 가변 크기 항목을 참조하십시오.
각 가변 크기 데이터 객체의 최대 크기를 명시적으로 지정하려면 크기 데이터 속성을 사용하십시오. 예를 들어, 첫 번째 차원의 최대 크기가 2, 두 번째 차원의 최대 크기가 4인 2차원 행렬을 지정하려면 [2 4]를 입력합니다. 배열을 제한 없음으로 설정하려면 크기 데이터 속성을 inf로 설정합니다. 예를 들어, 크기의 최댓값이 없는 2차원 행렬의 경우 [inf,inf]를 설정합니다.
또는 데이터의 최대 크기를 상속하려면 크기를 -1로 설정합니다. 자세한 내용은 Stateflow 데이터의 크기 지정하기 항목을 참조하십시오.
참고
스칼라 데이터에는 가변 크기 데이터를 활성화할 수 없습니다.
MATLAB을 동작 언어로 사용하는 차트의 가변 크기 데이터
MATLAB®을 동작 언어로 사용하는 차트는 가변 크기 차트 수준의 입력, 로컬, 출력 데이터뿐만 아니라 그래픽 함수, MATLAB 함수 및 진리표 함수에서 가변 크기 입력, 출력 데이터를 지원합니다.
상태 동작과 천이 동작에서 가변 크기 차트 데이터를 수정할 수 있습니다. 예를 들어, MATLAB을 동작 언어로 사용하는 이 차트에서, 상태 동작은 가변 크기 차트 출력 y를 스칼라부터 2×4 행렬까지의 크기 범위에 해당하는 값에 할당합니다.

이 예제에 대한 자세한 내용은 Compute Output Based on Size of Input Signal 항목을 참조하십시오.
C를 동작 언어로 사용하는 차트의 가변 크기 데이터
C를 동작 언어로 사용하는 차트는 가변 크기 차트 수준의 입력 및 출력 데이터뿐만 아니라 MATLAB 함수의 가변 크기 입력 데이터, 로컬 데이터, 임시 데이터, 출력 데이터와 MATLAB을 동작 언어로 사용하는 진리표 함수를 지원합니다.
가변 크기 차트 데이터는 다음을 사용해서만 수정할 수 있습니다.
MATLAB 함수
Simulink 함수
MATLAB을 동작 언어로 사용하는 진리표
가변 크기 데이터가 포함된 모든 계산은 이러한 함수의 내부에서 수행되어야 하며, 상태나 천이에서 직접 수행되지 않아야 합니다. 예를 들어, 가변 크기 차트 데이터를 상태 동작과 천이 동작으로부터 이러한 함수로 전달할 수 있습니다. 또는 MATLAB 함수가 가변 크기 차트 데이터에 직접 액세스할 수도 있습니다.
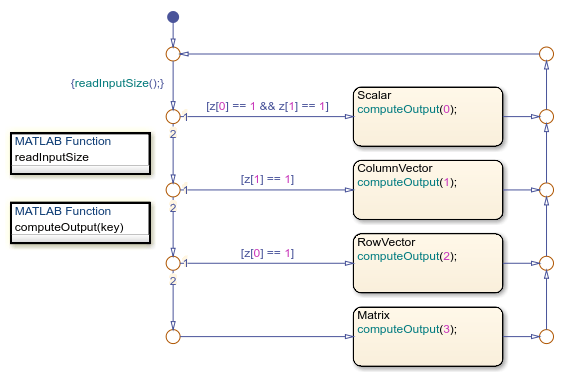
예를 들어, C를 동작 언어로 사용하는 이 차트에서 MATLAB 함수 readInputSize는 가변 크기 차트 입력의 크기를 확인합니다. 그런 다음 MATLAB 함수 computeOutput은 차트 입력에 크기 종속적인 알고리즘을 적용하고 가변 크기 차트 출력의 값을 설정합니다.

이 예제에 대한 자세한 내용은 Compute Output Based on Size of Input Signal 항목을 참조하십시오.