Model Coverage for Stateflow Atomic Subcharts
In a Stateflow® chart, an atomic subchart is a graphical object that allows you to reuse the same state or subchart across multiple charts and models.
When you specify to record coverage data for a model during simulation, Simulink® Coverage™ records coverage for any atomic subcharts in your model. The coverage data records the execution of the chart itself, and the execution of states, transition decisions, and individual conditions that compose each decision in the atomic subchart.
Simulate the sf_atomic_iodata_fixed example model and record
decision coverage:
Open the Stateflow example Map Input and Output Data for an Atomic Subchart.
openExample('stateflow/AtomicSubchartInOutDataExample');Open the
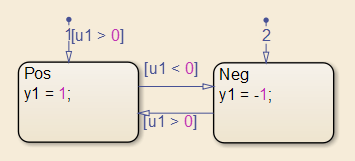
sf_atomic_iodata_fixedmodel.open_system('sf_atomic_iodata_fixed')This model contains two Sine Wave blocks that supply input signals to the Stateflow chart. This chart contains two atomic subcharts—A and B—that are linked from the same library chart, also named A. The library chart contains the following objects:

In the Simulink Editor, select Model Settings on the Modeling tab. Select the Coverage pane of the Configuration Parameters dialog box.
Select Enable coverage analysis and then select Entire System.
Click OK to close the Configuration Parameters dialog box.
Simulate the
sf_atomic_iodata_fixedmodel by clicking the Run button.When the simulation completes, the coverage report opens.
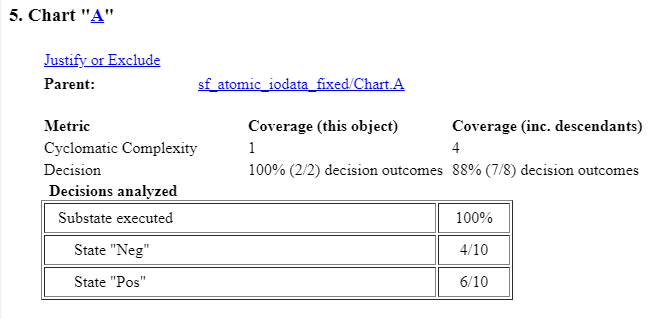
The report provides coverage data for atomic subcharts A and B in the following forms:
For the atomic subchart instance and its contents. Decision coverage is not applicable (
NA) because this chart does not have an explicit trigger.
For the library chart A and its contents. The chart itself achieves 100% coverage on the input
u1, and 88% coverage on the states and transitions inside the library chart.
Atomic subchart B is a copy of the same library chart A. The coverage of the contents of subchart B is identical to the coverage of the contents of subchart A.