Analyze Coverage and View Results
After you have enabled coverage and selected the metrics you want, you must simulate the model to collect the coverage results.
First, simulate the model by clicking the Analyze Coverage button. When the simulation completes, Simulink® Coverage™ highlights the model objects based on their coverage completeness.
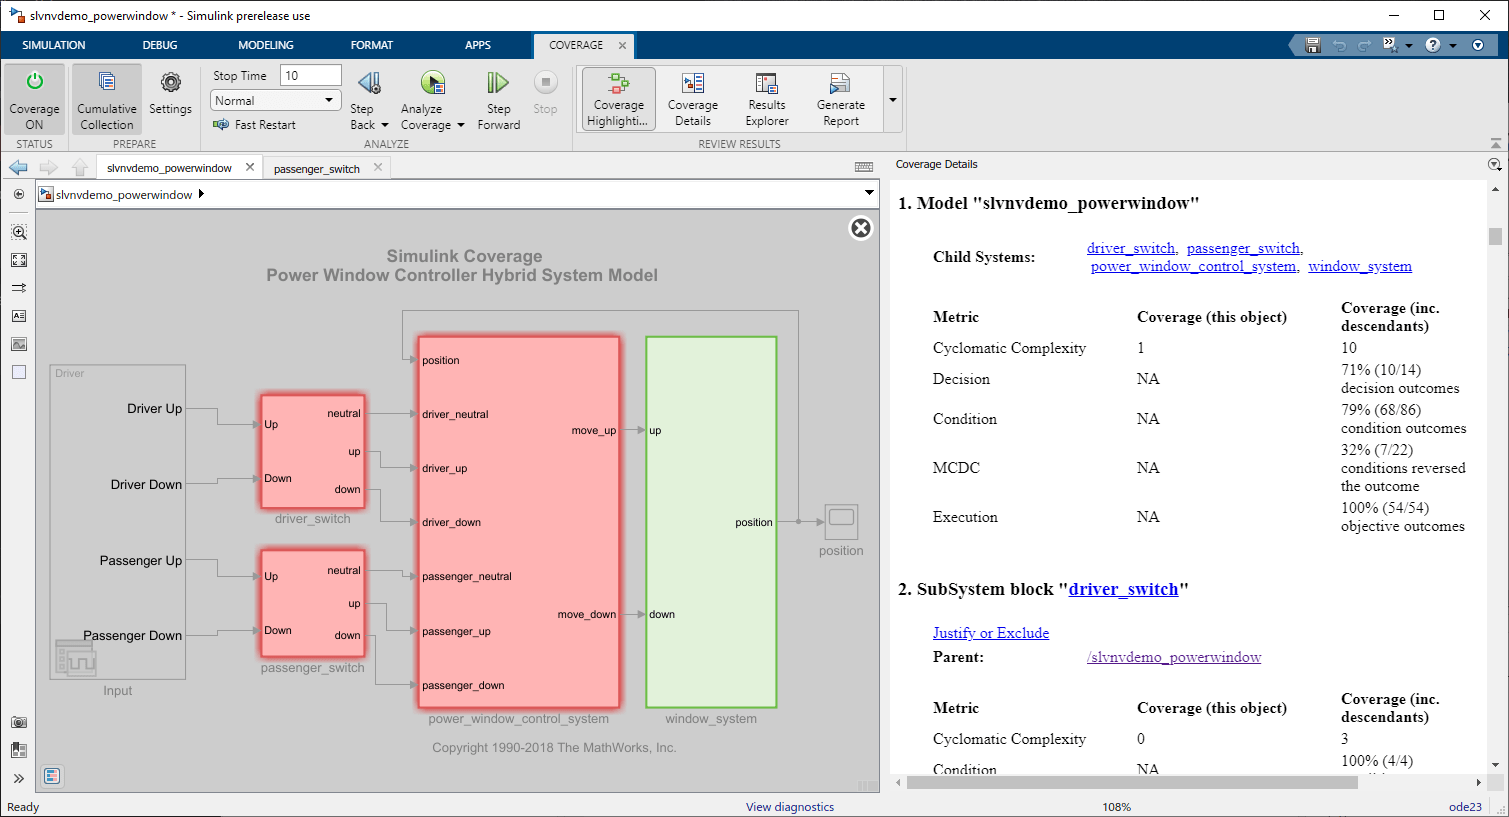
The Coverage Details pane opens automatically and displays the coverage report. The report automatically opens in the Details section which lists the coverage results for the model objects. You can scroll up to view the summary section and model information, or scroll down to browse the individual blocks.
The window_system subsystem is colored green because every block
inside the subsystem received 100% coverage. The other subsystems are colored red
because one or more blocks inside did not receive full coverage.
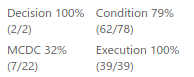
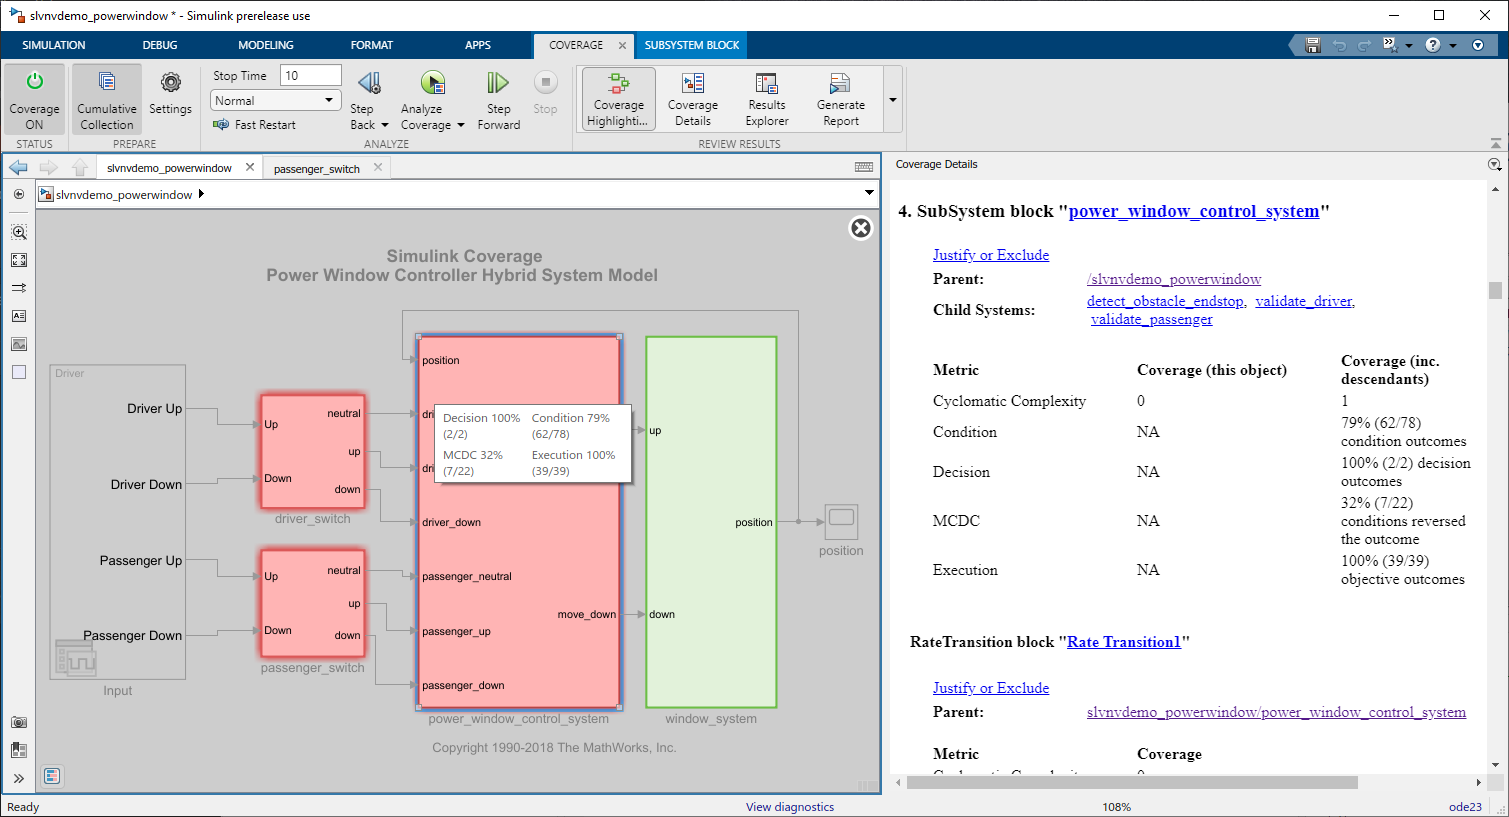
Point to a subsystem to display a short summary of coverage for each relevant metric.
For example, point to the power_window_control_system subsystem
block.
If you left click on a block, the Coverage Details pane displays
the section of the report for that block. For example, click the
power_window_control_system subsystem.
You can enter a subsystem to view the granular coverage results for the contents of
that subsystem. Double-click the power_window_control_system
subsystem to view the coverage results for the blocks it contains. Double-click on
validate_passenger and then on
check_up.
Click on the And block allow_action to display the
relevant section of the report.
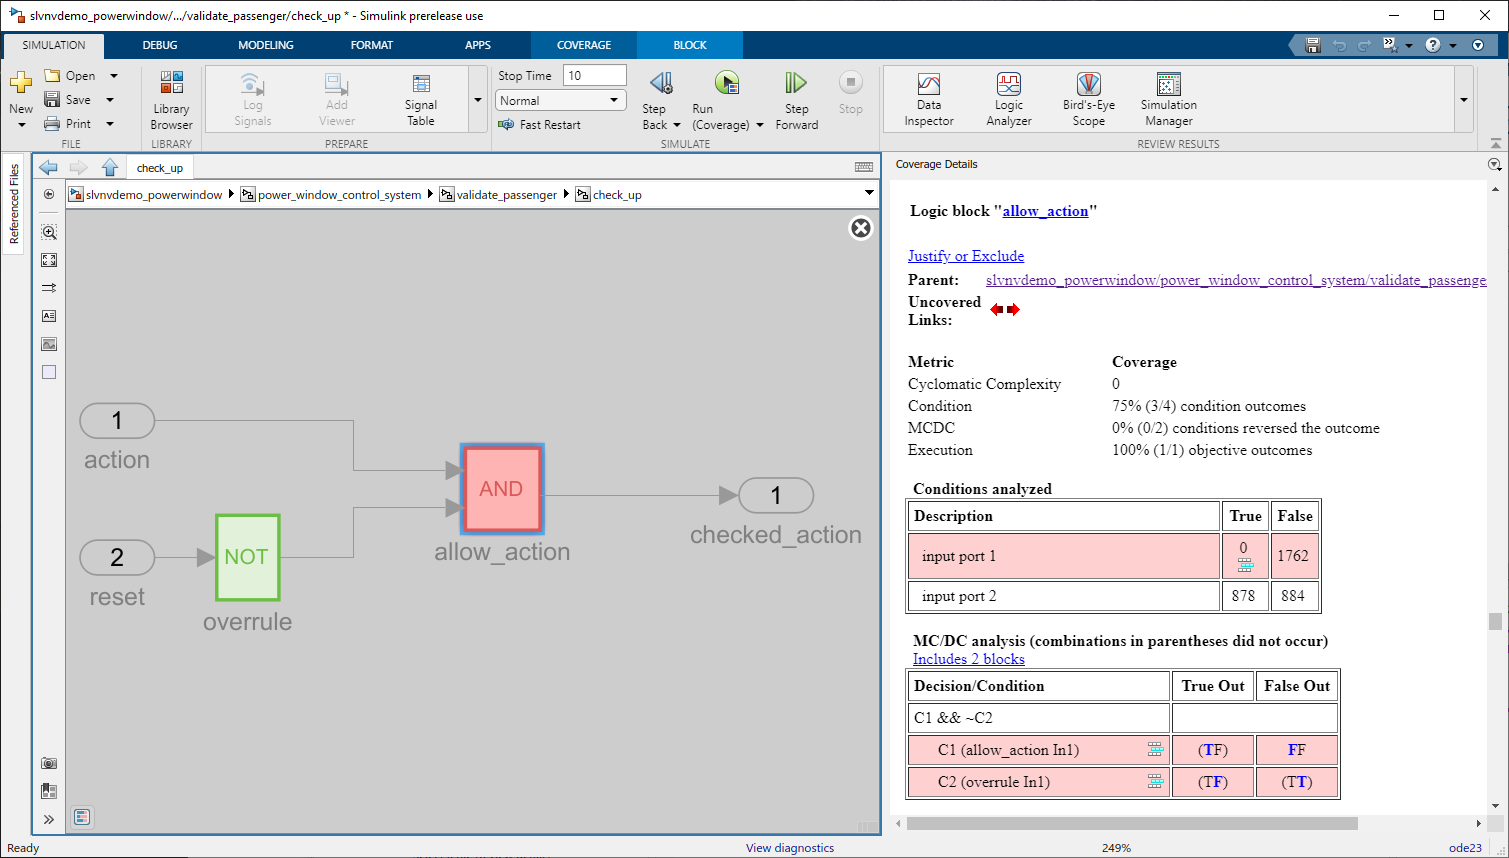
Because the And block outputs the logical combination of the two input
signals, if both input signals are true, the output signal is true. You can see from the
condition table that input signal 1 was False at every time step,
while input signal 2 was True for 878 time steps, and
False for 884 time steps.
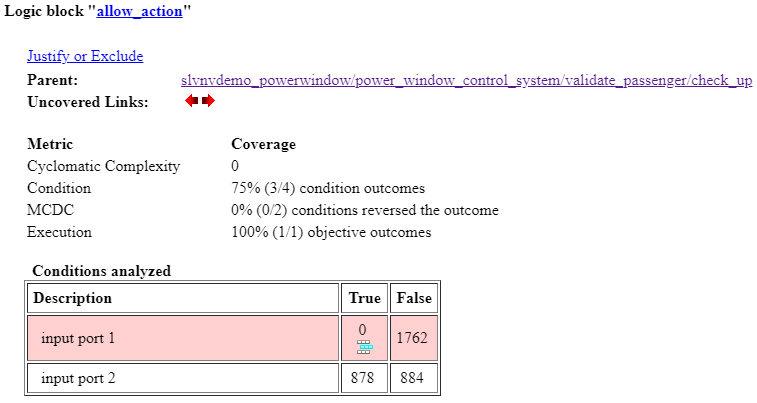
Because there are four condition outcomes and one of them did not occur, the
allow_action block received 75% condition coverage.
Below the Conditions analyzed table is the MC/DC analysis table.
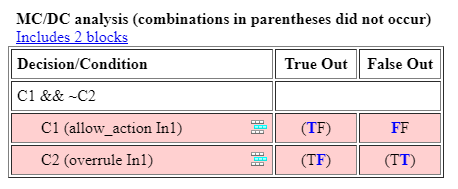
The MCDC analysis table lists decision reversals that occur because one condition
outcome changes from true to false or from
false to true. This table reports that the
only the FF case occurred during the simulation for first condition,
and neither MCDC objective occurred for the second condition, resulting in 0% MCDC
reported.
Command-Line Information
To perform the same steps from the command line, enter:
simOut = sim(simIn);
covData = simOut.covData;
cvmodelview(covData);