Debug Slice Simulation by Using Fast Restart Mode
Perform multiple slicer simulations and streamline model debugging workflows by using Model Slicer in fast restart mode. For more information, see Get Started with Fast Restart.
If you enable fast restart mode, you can:
Perform multiple slicer simulations efficiently with different inputs, without recompiling the model.
Debug a simulation by stepping through the major time steps of a simulation and inspecting how a slice changes. For more information, see Step Through Simulations Using the Simulink Editor.
Simulate and Debug a Test Case in a Model Slice
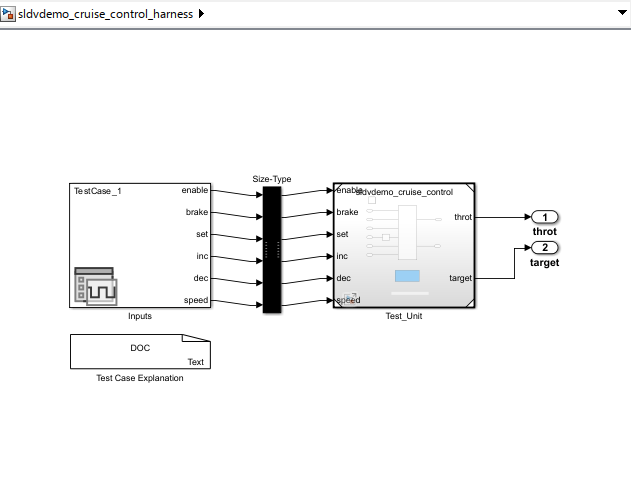
This example shows how the fast restart mode performs slicer simulations with different test case inputs, without recompiling the model. You can simulate a sliced harness model with a test case input and highlight the dependency analysis in the model.
Analyze the highlighted slice by stepping through the time steps. You use the simulation stepper to analyze how the slice changes at each time step.
1. Open the sldvdemo_cruise_control model.
open_system('sldvdemo_cruise_control');2. Set sldvoptions parameters and analyze the model by using the specified options.
opts = sldvoptions;
opts.Mode = 'TestGeneration';             % Perform test-generation analysis
opts.ModelCoverageObjectives = 'MCDC';    % Specify type of model coverage
opts.SaveHarnessModel = 'on';             % Save harness as model file
[ status, files ] = sldvrun('sldvdemo_cruise_control', opts);
19-Apr-2026 20:04:36
Checking compatibility for test generation: model 'sldvdemo_cruise_control'
Compiling model...done
Building model representation...done

19-Apr-2026 20:04:44

'sldvdemo_cruise_control' is compatible for test generation with Simulink Design Verifier.
Generating tests...


Generating output files:

    Harness model:
    /tmp/Bdoc26a_3233028_421015/tp39e99d31/slcheck-ex45330953/sldv_output/sldvdemo_cruise_control/sldvdemo_cruise_control_harness.slx

19-Apr-2026 20:05:13
Results generation completed.

    Data file:
    /tmp/Bdoc26a_3233028_421015/tp39e99d31/slcheck-ex45330953/sldv_output/sldvdemo_cruise_control/sldvdemo_cruise_control_sldvdata.mat
After the analysis, the software opens a harness model sldvdemo_cruise_control_harness and saves it in the default location <current_folder>\sldv_output\sldvdemo_cruise_control\sldvdemo_cruise_control_harness.slx.
3. On the Apps tab, under Model Verification, Validation, and Test gallery, click Model Slicer. Model Slicer compiles the model.
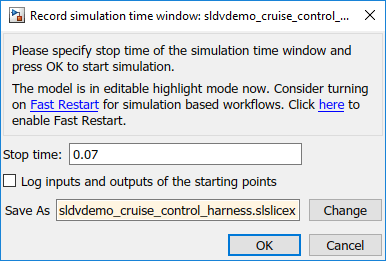
You can enable fast restart after opening the Model Slicer. Select Simulation time window and click the run simulation button. To enable fast restart, in the Record simulation time window, click the here link.
5. To add Starting Points, in the Model Slicer, click Add all outports..
The throt and target outports are added as the Starting Points.
6. You can simulate a test case and analyze the highlighted dependencies in the slice.
(a) In the Signal Editor block, select Test Case 1.
(b) Simulate the model by using the Run All button ![]() in the Simulink® editor. You can also simulate by using the Simulation time window in the Model Slicer.
in the Simulink® editor. You can also simulate by using the Simulation time window in the Model Slicer.
The slice shows the highlighted dependencies for the Test Case 1 inputs.

You can simulate a slice for different test case inputs and analyze the dependency analysis after you generate the slice of the model.
7. You can debug a slicer simulation by using a simulation stepper. For more information see, Step Through Simulations Using the Simulink Editor.
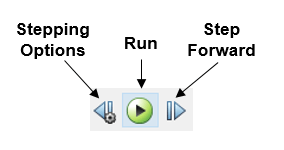
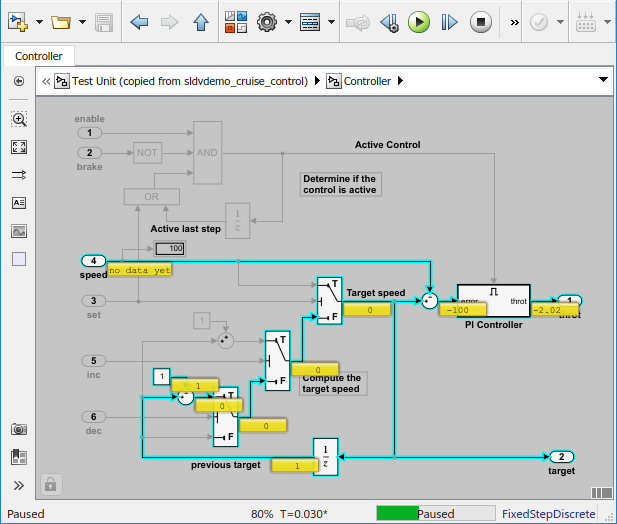
(a) To debug the simulation for the test case, in the Simulink® Editor for the sldvdemo_cruise_control_slice model, click Step Forward button. You can view the signal values and the highlighted slice at each time step. For more information, see Simulation Stepping Options. The signal values and the dependencies at T=0.010 appears.
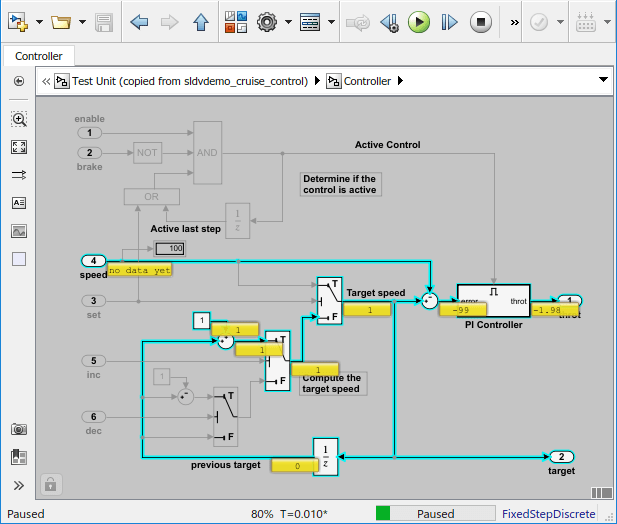
(b) To debug the slice at T=0.030, step forward and view the signal values and the highlighted slice.
8. To complete the simulation stepping, click the Run button.
See Also
Highlight Functional Dependencies