Analyze Jacobian Updates Using Solver Profiler
During simulation, implicit solvers use the Jacobian to compute the continuous state values at each time step. When the computed continuous state values do not satisfy the specified tolerance, the solver updates the Jacobian, which improves accuracy and stability but adds computational overhead. To better understand your model and choose the most appropriate solver for your model, you can analyze when Jacobian updates occur throughout simulation by using the Solver Profiler.
For information about available implicit solvers, see Variable Step Solvers in Simulink.
Open Model and Specify Implicit Solver
This example uses the Simscape™ model PneumaticActuationCircuit. For more information
about the model, see Pneumatic Actuation Circuit (Simscape).
Open the model PneumaticActuationCircuit.
mdl = "PneumaticActuationCircuit";
openExample("simscape/PneumaticActuationCircuitExample",...
    SupportingFile=mdl)
Implicit solvers are well suited to solving stiff systems and linearly implicit
systems, such as those modeled using Simscape physical modeling blocks. The Solver Profiler supports
Jacobian logging for all implicit solvers except the daessc solver.
To log and analyze Jacobian updates, specify the Solver parameter as
an implicit solver other than daessc, such as
ode23t.
set_param(mdl,Solver="ode23t")Open Solver Profiler and Configure Profiling Simulation
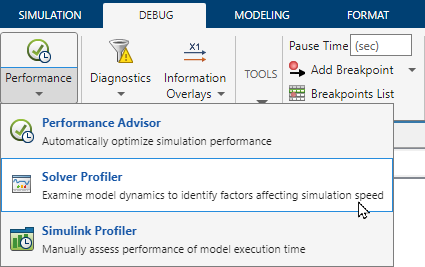
To log and analyze Jacobian updates, you must run a profiling simulation using the Solver Profiler. To open the Solver Profiler, in the Simulink® Toolstrip, on the Debug tab, in the Performance section, click the Performance button arrow, then select Solver Profiler.
In each profiling simulation, the Solver Profiler tracks when Jacobian updates occur throughout the simulation. You can also configure the Solver Profiler to log additional Jacobian data during the profiling simulation. The Solver Profiler uses the additional data to determine the state that most likely causes each update.
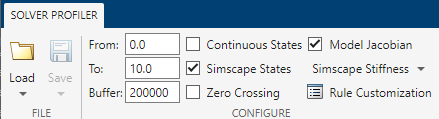
To log Jacobian data during the profiling simulation, in the Solver Profiler, in the Configure section, select Model Jacobian.
Run Profiling Simulation and View Results
To run the profiling simulation, in the Solver Profiler, click Run. When the profiling simulation completes, the Solver Profiler displays a plot of the step size throughout the simulation. To annotate the step size plot with a marker on each time step that required a Jacobian update, in the View section, select Jacobian Update.
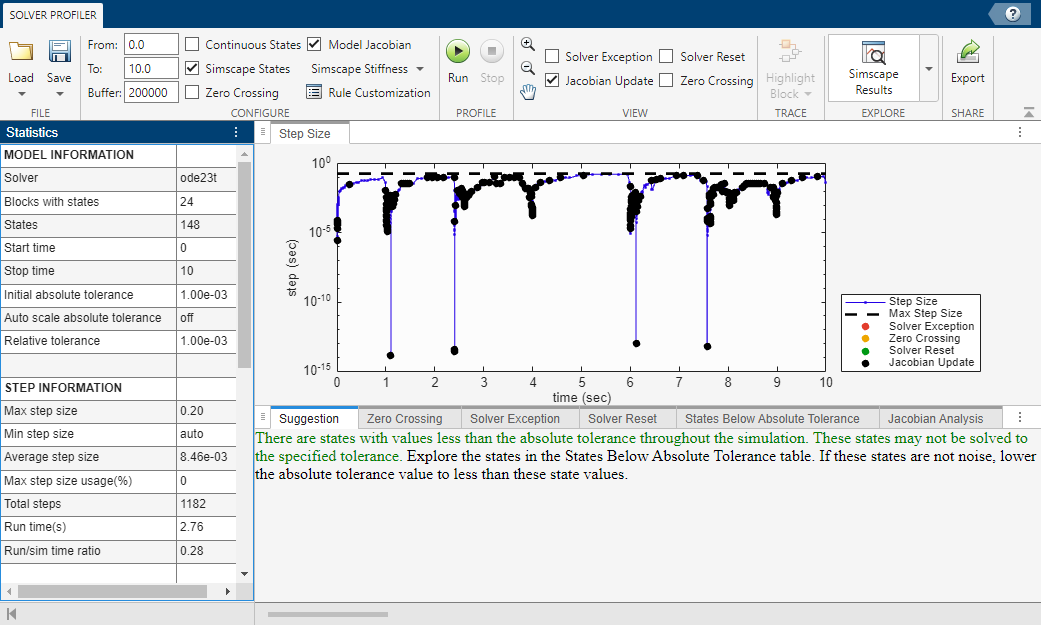
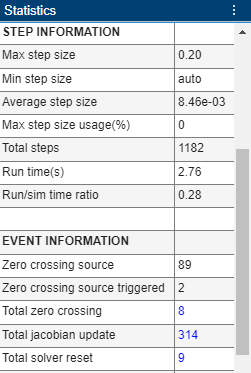
The Statistics pane provides information about the solver activity during the profiling simulation, including the total number of time steps and total number of Jacobian updates.
Analyze Limiting States
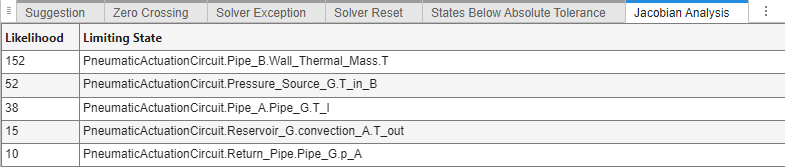
When you log Jacobian data, the Solver Profiler analyzes the Jacobian to determine the state that most likely caused the Jacobian update. To view the analysis of the Jacobian data, select the Jacobian Analysis tab. The tab displays a table of the limiting states in the system. The Limiting State column indicates the state that the Solver Profiler identified as the most likely cause for one or more Jacobian updates. The Likelihood column indicates the total number of Jacobian updates the Solver Profiler attributed to that state.
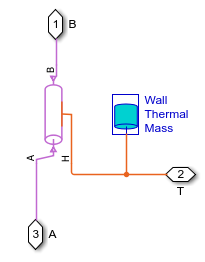
To analyze the state in the context of the model, you can highlight the block that corresponds to the limiting state identified in the Solver Profiler.
In the Jacobian Analysis tab, select a row for a limiting state.
In the Solver Profiler Toolstrip, click Highlight Block.

The Solver Profiler highlights the corresponding block in the block diagram.
See Also
Tools
- Solver Profiler | State Explorer | Zero Crossing Explorer | Simscape Results Explorer (Simscape)