Visualize and Plot N-Dimensional Data Using Mask Lookup Table Control
Look-Up Table control refers to a block or a set of blocks that use pre-defined data to map input values to output values. This is done without performing complex calculations during simulation or execution, which can significantly enhance performance and efficiency.
Use a lookup table to evaluate a sampled representation of a function using simple lookup operations. It enables you to assess the function with less computation time than running the function. You can visualize, edit, and plot N-dimensional lookup table data in mask dialog box using the lookup table control.

Visualize and Edit Table and Breakpoint Data Using the Lookup Table Control
Consider a scenario where the fuel flow is determined by the torque and engine speed. Specify the data explicitly for table data and breakpoint parameters.
1. Right-click the block named LUT Control with Explicit Data and select Edit Mask. In the Mask Editor dialog box, on the Parameters & Dialog pane, create Edit parameters Torque and Engine Speed for breakpoints. In the Property Editor pane, enter the values for the breakpoints in the Values field.
2. Create an Edit parameter Fuel Flow for table data in the Property Editor pane, enter the values in the Value field.
3. Add a lookup table control. Enter the table control. Enter the table properties Table Parameter, Table Unit, Table Display Name, Breakpoint Parameters, Breakpoint Units, and Breakpoints Display Name. Click OK.

4. Double-click the masked block to view the lookup table. Click a cell to edit the value.
Reference Promoted Parameters for Table and Breakpoint Data
You can follow the same steps to reference promoted parameters to build a lookup table.

Specify Table Data and Breakpoint Data Using Lookup Table Object
To reference an object in the lookup table control:
1. Create an object named lutobject in the model or base workspace with table and breakpoint data.
2. Create an Edit parameter and enter the value as lutobject created in the model workspace.
3. Create the lookup table control lutcontrol and reference the Edit parameter. The lookup table is now populated with the table and breakpoints data.

Switch Between Explicit Data Specification Mode and Data Referencing Mode
You can switch between explicit data specification mode and data referencing mode using a Popup parameter. Create a Popup parameter and use it in the lookup table control to choose between explicit data specification mode and data referencing mode.
Use callback code for the Popup parameter.
dataspec_paramName = 'dataspec';
  bp1_paramName = 'torque'; bp2_paramName = 'enginespeed'; tbl_paramName
  = 'fuelflow'; lutobj_paramName = 'lutobject'; underlyingLUTblock =
  'slexMaskLookupTableControlExample/LUT Control with Data Specification
  Mode/2-D Lookup Table';
  dataSpec = get_param(gcb, dataspec_paramName);
  maskObj = Simulink.Mask.get(gcb);
  lutoParam = maskObj.getParameter(lutobj_paramName);
  bp1Param = maskObj.getParameter(bp1_paramName);
  bp2Param = maskObj.getParameter(bp2_paramName);
  tableParam = maskObj.getParameter(tbl_paramName);
  set_param(underlyingLUTblock, 'DataSpecification', dataSpec);
  if strcmp(dataSpec, 'Lookup table object')
      bp1Param.Visible = 'off';
      bp2Param.Visible = 'off';
      tableParam.Visible = 'off';
      lutoParam.Visible = 'on';
  else
      bp1Param.Visible = 'on';
      bp2Param.Visible = 'on';
      tableParam.Visible = 'on';
      lutoParam.Visible = 'off';
  end

Share Explicit Breakpoint Data Between Lookup Tables
Many applications use the same breakpoints for different kinds of data. You can create multiple lookup tables by sharing breakpoint data. For example, Exhaust Temperature, Air Pressure, and Fuel Flow use the same breakpoints Torque and Engine Speed. Create multiple containers in the Mask Editor for each lookup table and use the same breakpoints in each table.


Visualize Multidimensional Data
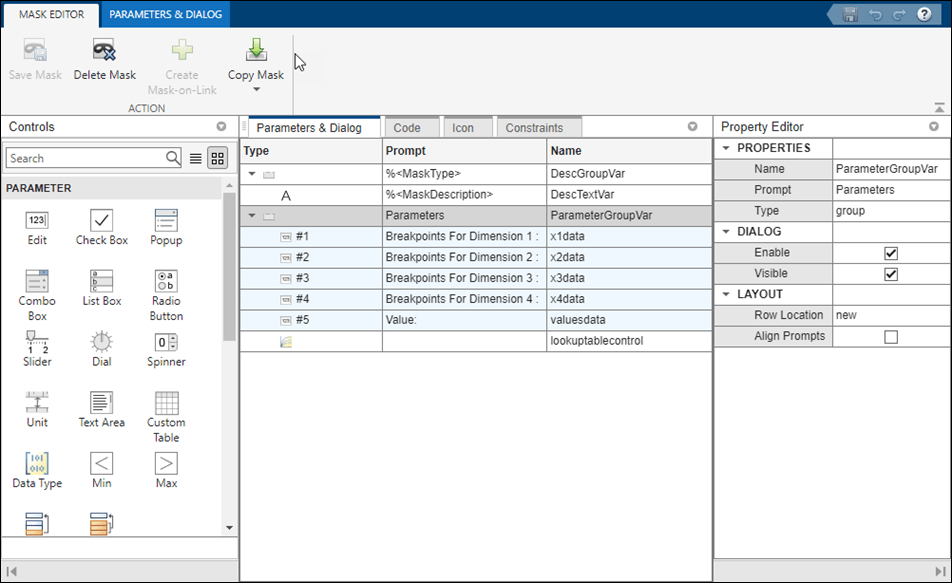
To visualize multidimensional data, create Edit parameters for table data and breakpoints and enter the values. To visualize the data for a dimension, select the parameter for that dimension from the list.

Plot Multidimensional Data
Plot multidimensional lookup data in a contour, mesh, line, or surface plot. Click a table cell to highlight the corresponding plot point. You can also create a plot from only a subset of dimensions or slices.

Lookup Table Control Menu Options
Plot Toolbar Options
Rotate: Rotate the plot, click the rotate icon and then click the plot to rotate the plot in 3-D view.
Panning Tool: Move the plot up and down and side to side using the pan tool. Double-click the pan tool to center it or reset it to the original position.
Zoom: Zoom in or zoom out of the plot.
Home: Click the home icon to restore the view.
Settings
Spreadsheet: Show or hide the spreadsheet view of the lookup table data.
Heat Map: Show or hide the heat map in the spreadsheet view.
Plot: Select the desired plot. The available plots are Contour, Mesh, Line, and Surface. One dimensional data can be plotted only with Line plot.
Add Lookup Table Control Programmatically
Add mask lookup table control programmatically by following these steps.
1. Get the mask object.
maskObj = Simulink.Mask.get(blkhndl);
2. Add table data and breakpoint parameters to the mask.
maskObj.addParameter('Name', 'torque', 'Prompt', 'Torque:', 'Type',  'edit');
maskObj.addParameter('Name', 'speed', 'Prompt', 'Engine speed:', 'Type',  'edit');
maskObj.addParameter('Name', 'fuelflowtable', 'Prompt', 'Fuel Flow Map:', 'Type',  'edit');
3. Add lookup table control.
lutControl = maskObj.addDialogControl('Name','fuelflowlut','Type','lookuptablecontrol');
4. Set the table properties.
lutControl.Table.Name = 'fuelflowtable';
lutControl.Table.Unit = 'kg/s' ;
lutControl.Table.FieldName = 'Fuel Flow';
Set the breakpoint properties of first dimension.
lutControl.Breakpoints(1).Name = 'torque';
lutControl.Breakpoints(1).Unit = 'Nm';
lutControl.Breakpoints(1).FieldName = 'Torque';
Set breakpoint properties of second dimension.
lutControl.Breakpoints(2).Name = 'speed';
lutControl.Breakpoints(2).Unit = 'rpm';
lutControl.Breakpoints(2).FieldName = 'Speed';
See Also
Simulink.dialog.LookupTableControl Simulink.dialog.LookupTableControl.TableSimulink.dialog.LookupTableControl.Breakpoints