plot
Draw graph connecting series of points on masked block icon
Description
plot( plots against an implicit set of x-coordinates. y)
If
yis a vector, the x-coordinates range from 1 tolength(y).If
yis a matrix, the plot contains one line for each column iny. The x-coordinates range from 1 to the number of rows iny.
plot(
plots multiple pairs of x- and y-coordinates with in the same masked block. Vector pairs
must be the same length.x1,y1,.......xn,yn)
Input arguments can include NaN and inf values. When Simulink® encounters NaNs or inf values in an
input argument to the plot function, it stops drawing and begins drawing again at the next
numbers that are not NaNs or inf. The appearance of
the plot on the icon depends on the Icon units setting in the Mask
Editor.
Simulink displays three question marks (? ? ?) in the block icon and
issues warnings in these scenarios:
When you do not define values for the parameters used in the drawing commands.
When you enter a block parameter or drawing command incorrectly.
The plot function used for drawing masked block icons supports a
subset of the syntax of the MATLAB®
plot function, supports all numeric data types, and accepts only numbers
as input.
Examples
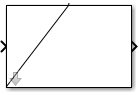
Draw a masked block icon using vector indexes.
plot([0 1 5])
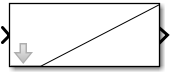
Draw a masked block icon similar to the icon of the Ramp block in the Sources library.
plot([0 1 5], [0 0 4])
Input Arguments
Version History
Introduced in R2006a