피크 폭 결정하기
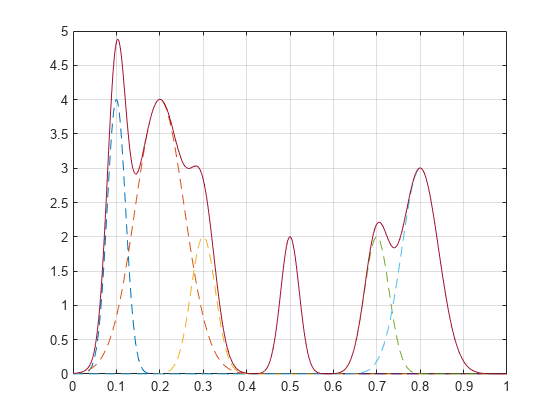
가우스 곡선의 합으로 구성된 신호를 생성합니다. 각 곡선의 위치, 높이, 폭을 지정합니다.
x = linspace(0,1,1000);

Pos = [1 2 3 5 7 8]'/10;
Hgt = [7 6 3 2 2 3]';
Wdt = [3 8 4 3 4 6]'/100;

y = sum(Hgt.*(exp(-((x-Pos)./Wdt).^2)),1);
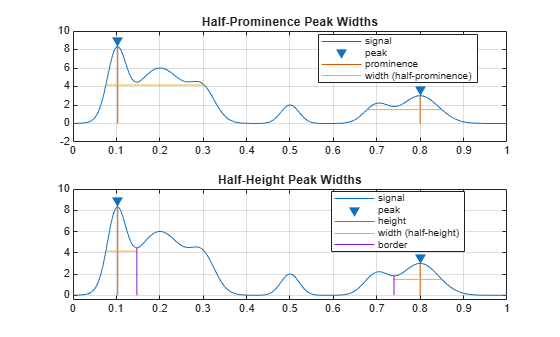
돌출부의 절반과 높이의 절반을 기준으로 사용하여 피크의 폭을 측정합니다.
tiledlayout("flow")
nexttile
findpeaks(y,x,Annotate="extents")
title("Half-Prominence Peak Widths")
nexttile
findpeaks(y,x,Annotate="extents",WidthReference="halfheight")
title("Half-Height Peak Widths")
x축에서 최소 0.5 단위 이상의 간격으로 분리된 가장 높은 피크를 선택합니다. 돌출부의 절반과 높이의 절반을 기준으로 사용하여 피크의 폭을 측정합니다.
figure
tiledlayout("flow")
nexttile
findpeaks(y,x,MinPeakDistance=0.5,Annotate="extents")
title("Half-Prominence Peak Widths")
nexttile
findpeaks(y,x,MinPeakDistance=0.5,Annotate="extents", ...
    WidthReference="halfheight")
title("Half-Height Peak Widths")
첫 번째 피크와 마지막 피크만 최소 분리 조건을 충족하므로, 플롯에 표시된 폭은 이 두 피크에 해당합니다. 각 피크의 범위는 변경되지 않으므로, 지정된 조건과 피크 선택 여부에 관계없이 피크의 폭 값은 그대로 유지됩니다.