주요 콘텐츠

risk.validation.cumulativeAccuracyProfile

R2026b

Plot cumulative accuracy profile

Since R2026b

    Description

    risk.validation.cumulativeAccuracyProfile(Score,BinaryResponse) plots the cumulative accuracy profile (CAP) for the classification results determined by the Score and BinaryResponse arguments. The plot also includes a dotted line and a solid line indicating the CAP of a random model and a perfect model, respectively, and shows the accuracy ratio (AR) in the lower right corner.

    risk.validation.cumulativeAccuracyProfile(ax,___) plots into the axes specified by ax instead of into the current axes (gca).

    risk.validation.cumulativeAccuracyProfile(___,Name=Value) specifies additional options using one or more name-value arguments. For example, you can specify the direction in which to sort the score variable and whether to plot the CAP of a perfect model.

    example

    h = risk.validation.cumulativeAccuracyProfile(___) returns handles to the plotted graphics objects.

    Examples

    collapse all

    Load credit validation data.

    load CreditValidationData.mat

    The CreditScore and Default variables in the ScorecardValidationData table, respectively, contain data for the credit score and whether the customer defaulted. Plot the cumulative accuracy profile (CAP) of the data and use the ModelID name-value argument to give a name to the model in the legend of the plot. Specify the SortDirection name-value argument as "ascending" because low credit scores correspond to a higher probability of default.

    CreditScore = ScorecardValidationData.CreditScore;
    Default = ScorecardValidationData.Default;
    risk.validation.cumulativeAccuracyProfile(CreditScore,Default,ModelID="Scorecard",SortDirection="ascending")
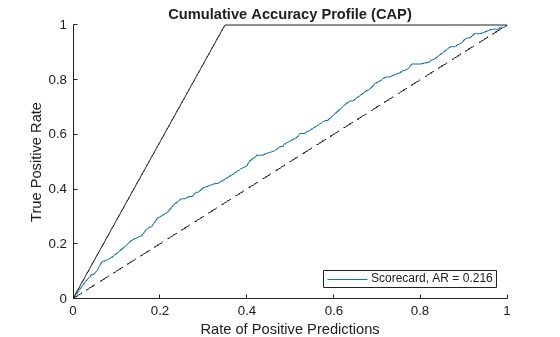
    Figure contains an axes object. The axes object with title Cumulative Accuracy Profile (CAP), xlabel Rate of Positive Predictions, ylabel True Positive Rate contains 3 objects of type line. This object represents Scorecard, AR = 0.216.

    The plot shows the CAP for the data in a solid blue line, the CAP of a perfect model in a solid black line, and the CAP of a random model in a dotted line. The plot also shows the name of the model and the accuracy ratio (AR) in the lower right corner.

    Load credit validation data.

    load CreditValidationData.mat

    The ScorecardPD and DecisionTreePD variables in the PDModelsValidationData table contain data for the customer probability of default (PD) based, respectively, on a scorecard and a decision tree model. The Default variable contains data for whether the customer defaulted. Plot the cumulative accuracy profiles (CAPs) for both models by specifying the Score argument as a matrix with two columns.

    ScorecardPD = PDModelsValidationData.ScorecardPD;
    DecisionTreePD = PDModelsValidationData.DecisionTreePD;
    Default = PDModelsValidationData.Default;
    risk.validation.cumulativeAccuracyProfile([ScorecardPD DecisionTreePD],Default,ModelID=["Scorecard" "Decision tree"])
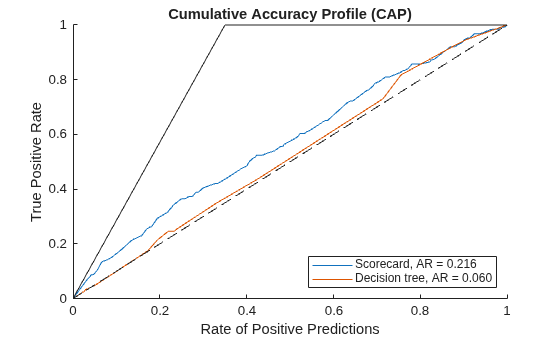
    Figure contains an axes object. The axes object with title Cumulative Accuracy Profile (CAP), xlabel Rate of Positive Predictions, ylabel True Positive Rate contains 4 objects of type line. These objects represent Scorecard, AR = 0.216, Decision tree, AR = 0.060.

    The plot shows the CAPs for the two models.

    Input Arguments

    collapse all

    Score values, specified as a numeric matrix, containing values that indicate quantities such as rankings, predictions, probability of default (PD) estimates, or loss given default (LGD) estimates. The number of columns of the matrix is the number of models and the number of rows is the number of observations per model. The risk.validation.cumulativeAccuracyProfile function uses the BinaryResponse argument to separate the score values into two samples. The number of rows in Score must match the number of entries in BinaryResponse.

    Data Types: double | single

    Binary response, specified as a numeric or logical vector containing values of 1 (true) or 0 (false). The binary response represents the target state for each value in Score. For example, you can use the binary response to represent a discretized loss given default (LGD) target, where values of 1 indicate high LGD values. The number of entries in BinaryResponse must match the number of rows in Score.

    Target axes, specified as an Axes object. If you do not specify the axes by using the ax input argument or the Parent name-value argument, then the risk.validation.cumulativeAccuracyProfile function uses the current axes (gca) or creates an Axes object if one does not exist. For more information on creating an Axes object, see axes and Axes Properties.

    Note

    The risk.validation.cumulativeAccuracyProfile function ignores the ax argument when you specify the Parent name-value argument.

    Name-Value Arguments

    collapse all

    Specify optional pairs of arguments as Name1=Value1,...,NameN=ValueN, where Name is the argument name and Value is the corresponding value. Name-value arguments must appear after other arguments, but the order of the pairs does not matter.

    Example: risk.validation.cumulativeAccuracyProfile(Score,BinaryResponse,SortDirection="ascending",ShowPerfectModel=false)

    Labels for models, specified as a string scalar, string vector, character vector, or cell array of character vectors. The risk.validation.cumulativeAccuracyProfile function uses the strings in ModelID as the labels in the legend of the plot.

    • If Score has more than one column, then the default labels in the legend are Model1, Model2, …, Modeln.

    • If Score has only one column, then the default label in the legend is Model.

    Example: ModelID="Original Model"

    Example: ModelID=["Original Model" "Updated Model"]

    Data Types: string | char

    Target axes, specified as an Axes object. If you do not specify the axes by using the Parent name-value argument or the ax input argument, then the risk.validation.cumulativeAccuracyProfile function uses the current axes (gca) or creates an Axes object if one does not exist. For more information on creating an Axes object, see axes and Axes Properties.

    Note

    The risk.validation.cumulativeAccuracyProfile function ignores the ax argument when you specify the Parent name-value argument.

    Whether to show the plot of a random model, specified as a numeric or logical 1 (true) or 0 (false).

    Example: ShowRandomModel=false

    Whether to show the plot of a perfect model, specified as a numeric or logical 1 (true) or 0 (false).

    Example: ShowPerfectModel=false

    Sorting direction of the score variable, specified as "descending" or "ascending".

    If you are plotting credit scores, where lower values correspond to higher risk, then specify SortDirection as "ascending" to ensure that TruePositiveRate represents the proportion of defaulters.

    Example: SortDirection="ascending"

    Data Types: string | char

    Output Arguments

    collapse all

    Handles to plotted graphics objects, returned as a Line vector. For more information, see Line Properties.

    Version History

    Introduced in R2026b