TCN 이상 감지기 훈련 및 테스트하기
두 세트의 합성 3채널 정현파 신호가 포함된 파일 sineWaveAnomalyData.mat를 불러옵니다.
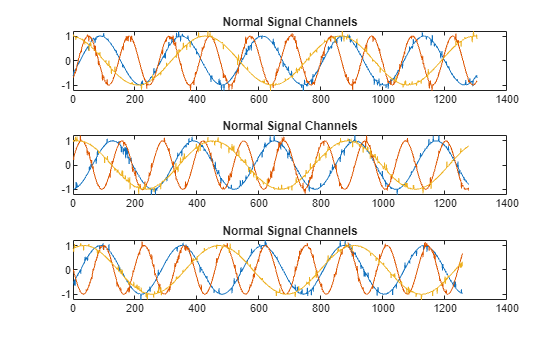
sineWaveNormal은 주파수와 진폭이 안정적인 정현파 10개를 포함합니다. 각 신호에는 충격을 받은 것처럼 보이는 일련의 작은 결함이 있습니다. 신호는 길이와 초기 위상이 서로 다릅니다.
load sineWaveAnomalyData.mat sineWaveNormal sineWaveAbnormal
s1 = 3;
입력 신호 플로팅하기
처음 3개의 정상 신호를 플로팅합니다. 각 신호에는 3개의 입력 채널이 포함되어 있습니다.
tiledlayout("vertical")
ax = zeros(s1,1);
for kj = 1:s1
ax(kj) = nexttile;
    plot(sineWaveNormal{kj})
    title("Normal Signal Channels")
end
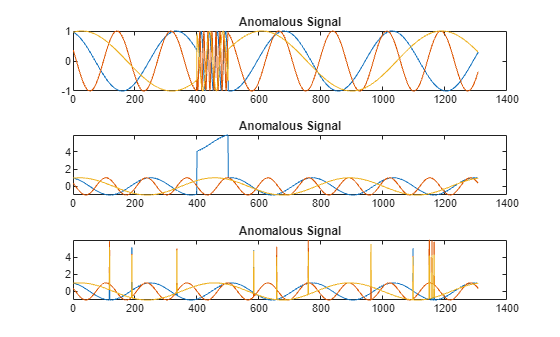
sineWaveAbnormal은 길이가 모두 동일한 3개의 신호를 포함합니다. 이 세트의 각 신호에는 이상이 하나 이상 있습니다.
첫 번째 신호의 모든 채널은 주파수가 급격하게 변하고 이는 유한한 시간 동안 지속됩니다.
두 번째 신호는 채널 중 하나에서 유한한 시간 동안 진폭에 변화가 있습니다.
세 번째 신호는 모든 채널에서 시시때때로 튀어오릅니다.
이상이 있는 3개의 신호를 플로팅합니다.
tiledlayout("vertical")
ax = zeros(s1,1);
for kj = 1:s1
ax(kj) = nexttile;
    plot(sineWaveAbnormal{kj})
    title("Anomalous Signal")
end
감지기 만들기
tcnAD 함수를 사용하여 디폴트 옵션으로 tcnDetector 객체를 만듭니다.
detector_tcn = tcnAD(3)
detector_tcn =
  TcnDetector with properties:

               FilterSize: 7
       DropoutProbability: 0.2500
    DetectionWindowLength: 10
               NumFilters: 32
                IsTrained: 0
              NumChannels: 3
                   Layers: [23×1 nnet.cnn.layer.Layer]
                    Dlnet: [1×1 dlnetwork]
                Threshold: []
          ThresholdMethod: "kSigma"
       ThresholdParameter: 3
        ThresholdFunction: []
            Normalization: "zscore"
          DetectionStride: 10
감지기 훈련시키기
trainingOptions 옵션을 사용자 지정(솔버를 "adam"으로, 훈련 Epoch 횟수에 대한 제한을 100으로 설정)하여 detector_tcn을 훈련시킬 준비를 합니다.
trainopts = trainingOptions("adam",MaxEpochs=100);정상 데이터와 trainopts를 사용하여 detector_tcn을 훈련시킵니다.
detector_tcn = train(detector_tcn,sineWaveNormal,trainingOpts=trainopts);
    Iteration    Epoch    TimeElapsed    LearnRate    TrainingLoss
    _________    _____    ___________    _________    ____________
            1        1       00:00:00        0.001          2.3547
           50       50       00:00:08        0.001         0.16135
          100      100       00:00:16        0.001         0.10187
Training stopped: Max epochs completed
Computing threshold...
Threshold computation completed.
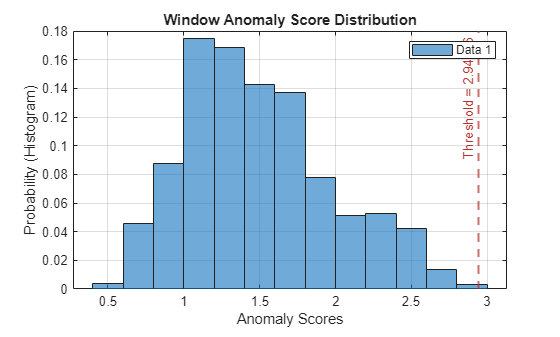
train이 계산하여 detector_tcn 내에 저장하는 임계값을 표시합니다. 이 계산된 값은 임의의 요소(예: 훈련에 사용된 데이터의 서브셋)의 영향을 받으므로, 사용하는 컴퓨터나 훈련 세션에 따라 약간 다를 수 있습니다.
thresh = detector_tcn.Threshold
thresh =
2.9427
정상 데이터에 대한 이상 점수의 히스토그램을 플로팅합니다. 각 점수는 하나의 감지 기간에 대해 계산됩니다. 임계값(세로선으로 플로팅됨)이 항상 점수의 범위를 온전하게 제한하는 것은 아닙니다.
plotHistogram(detector_tcn,sineWaveNormal)
감지기를 사용하여 이상 식별하기
detect 함수를 사용하여 이상 데이터에 대한 이상 점수를 확인합니다.
results = detect(detector_tcn, sineWaveAbnormal)
results=3×1 cell array
    130×3 table
    130×3 table
    130×3 table
results는 3개의 테이블(각 채널에 대해 하나의 테이블)을 포함하는 셀형 배열입니다. 각 셀형 테이블에는 3개의 변수 WindowLabel, WindowAnomalyScore, WindowStartIndices가 포함되어 있습니다. 테이블 변수 이름을 확인합니다.
varnames = results{1}.Properties.VariableNamesvarnames = 1×3 cell array
"'Labels'" "'AnomalyScores'" "'StartIndices'"
결과 플로팅하기
정상 데이터, 이상 데이터, 임계값을 표시하는 히스토그램을 하나의 플롯에 플로팅합니다.
plotHistogram(detector_tcn,sineWaveNormal,sineWaveAbnormal)
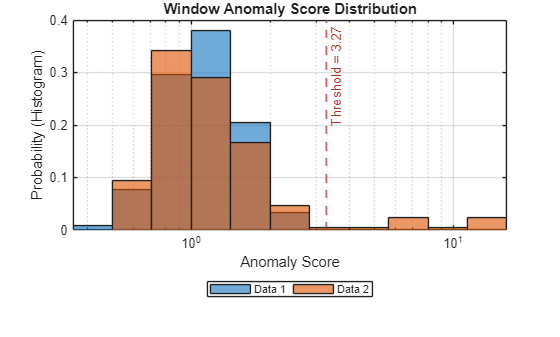
이 히스토그램은 정상 데이터와 이상 데이터에 서로 다른 색을 사용합니다.
세 번째 이상 신호 세트의 감지된 이상을 플로팅합니다.
plot(detector_tcn,sineWaveAbnormal{3})
위쪽 플롯에서는 이상이 발생한 위치에 빨간색이 겹쳐 표시됩니다. 아래쪽 플롯에서는 신호 세트 3에 대해 정상 점수와 이상 점수를 가르는 데 있어 임계값이 얼마나 효과적인지를 보여줍니다.