이 페이지는 기계 번역을 사용하여 번역되었습니다. 영어 원문을 보려면 여기를 클릭하십시오.
Polyspace Access 웹 인터페이스의 호출 계층 구조
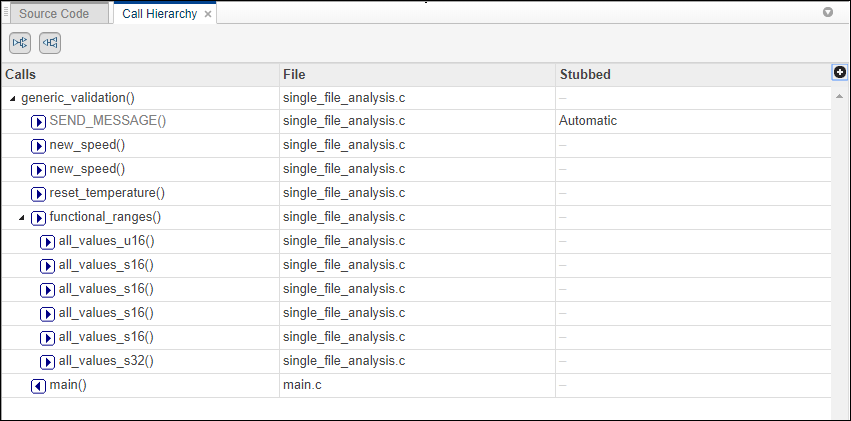
Call Hierarchy 창은 소스 코드 내 함수의 호출 트리를 표시합니다.
foo 함수마다, Call Hierarchy 패널에는 foo를 호출하는 함수 및 작업(호출자)과 foo가 호출하는 함수 및 작업(피호출자)이 나열됩니다. 발신자는  로 표시됩니다. 수신자는
  로 표시됩니다. Call Hierarchy 창에는 직접 함수 호출과 함수 포인터를 통한 간접 호출이 나열됩니다.
참고
Polyspace® Access™ 검출 항목 결과에서는 함수의 모든 호출자나 피호출자를 확인하지 못할 수 있습니다. 특히 함수 포인터를 통한 호출이나 사멸된 코드의 경우 더욱 그렇습니다.
예를 들어, Polyspace Access는 at_exit()와 at_quick_exit()에 등록되고 각각 exit()와 quick_exit()에 의해 호출되는 함수를 표시하지 않습니다.
Call Hierarchy 패널은 Results Details 패널의 ![]() 아이콘을 사용하거나 Window > Call Hierarchy로 이동하여 열 수 있습니다.
아이콘을 사용하거나 Window > Call Hierarchy로 이동하여 열 수 있습니다.
패널을 업데이트하려면 Results List에서 결함을 클릭하거나 Source Code 패널에서 결과를 Ctrl+클릭하십시오. 결함이 있는 함수와 그 호출자 및 피호출자를 볼 수 있습니다.
이 예시에서 Call Hierarchy 패널은 함수 generic_validation와 그 호출자 및 피호출자를 표시합니다.
팁
소스 코드에서 호출 위치를 탐색하려면 발신자 또는 수신자 이름을 선택하십시오.
Call Hierarchy 창에서 다음 작업을 수행할 수 있습니다:
