STEP 파일 가져오기
이 예제에서는 STEP 파일에서 지오메트리를 가져온 다음 그 지오메트리를 플로팅하는 방법을 보여줍니다. 가져온 후에는 pdegplot 함수를 사용하여 지오메트리를 표시합니다.
Partial Differential Equation Toolbox™에 포함된 STEP 파일에서 지오메트리 예제를 가져와 표시합니다. 면 ID를 확인하려면 FaceLabels 이름-값 인수를 "on"으로 설정합니다. 지오메트리의 모든 면에 있는 레이블을 확인하려면 투명도를 0.3으로 설정합니다.
figure
gm = fegeometry("AngleBlock.step");
pdegplot(gm,FaceLabels="on",FaceAlpha=0.3)
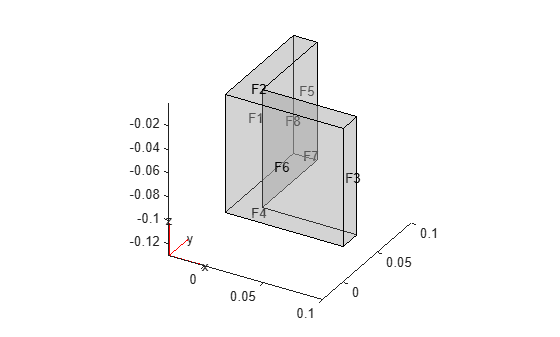
figure
gm = fegeometry("AngleBlockBlendR10.step");
pdegplot(gm,FaceLabels="on",FaceAlpha=0.3)
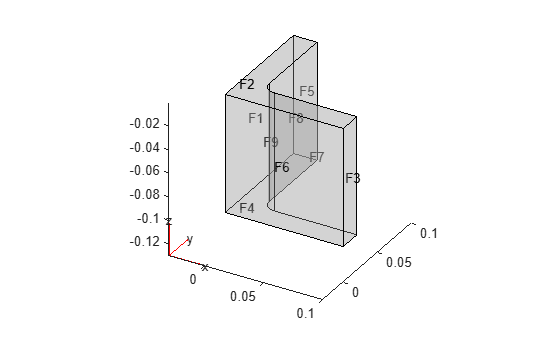
figure
gm = fegeometry("BlockBlendR15.step");
pdegplot(gm,FaceLabels="on",FaceAlpha=0.3)
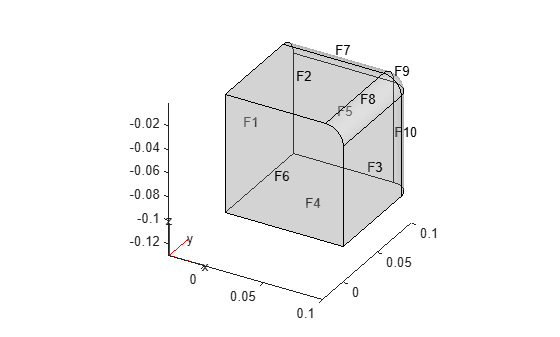
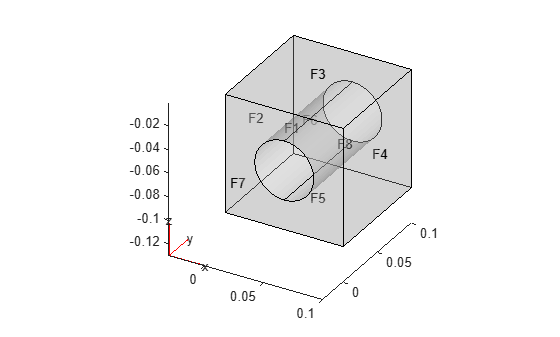
figure
gm = fegeometry("BlockWithHole.step");
pdegplot(gm,FaceLabels="on",FaceAlpha=0.3)