이 번역 페이지는 최신 내용을 담고 있지 않습니다. 최신 내용을 영문으로 보려면 여기를 클릭하십시오.
MATLAB 함수를 사용한 2차원 해 및 기울기 플롯
해와 기울기(필요한 경우)를 각각의 단계에서 보간한 다음 MATLAB® 함수(예: surf, mesh, quiver 등)를 사용하여 그 결과를 플로팅할 수 있습니다. 예를 들어, L 모양의 멤브레인에서 디리클레(Dirichlet) 경계 조건이 0인 동일한 스칼라 타원 문제 을 풀어 보겠습니다. 해와 그 기울기를 보간한 다음 결과를 플로팅합니다.
PDE 모델, 2차원 지오메트리, 메시를 만듭니다. 경계 조건과 계수를 지정합니다. PDE 문제를 풉니다.
model = createpde;
geometryFromEdges(model,@lshapeg);
applyBoundaryCondition(model,"dirichlet", ...
                       Edge=1:model.Geometry.NumEdges, ...
                       u=0);
c = 1;
a = 0;
f = 1;
specifyCoefficients(model,m=0,d=0,c=c,a=a,f=f);
generateMesh(model,Hmax=0.05);
results = solvepde(model);
해와 그 기울기를 각 방향으로 -1에서 1까지의 조밀한 그리드로 보간합니다.
v = linspace(-1,1,101);
[X,Y] = meshgrid(v);
querypoints = [X(:),Y(:)]';
uintrp = interpolateSolution(results,querypoints);
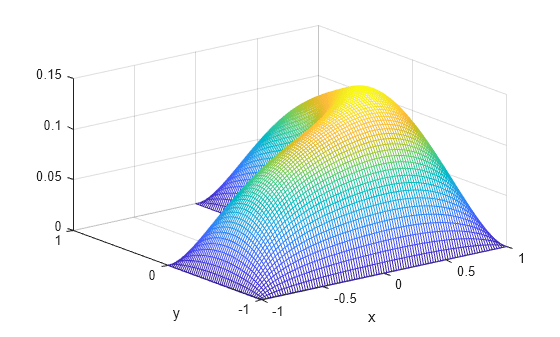
결과 해를 메시에 플로팅합니다.
uintrp = reshape(uintrp,size(X));
mesh(X,Y,uintrp)
xlabel("x")
ylabel("y")
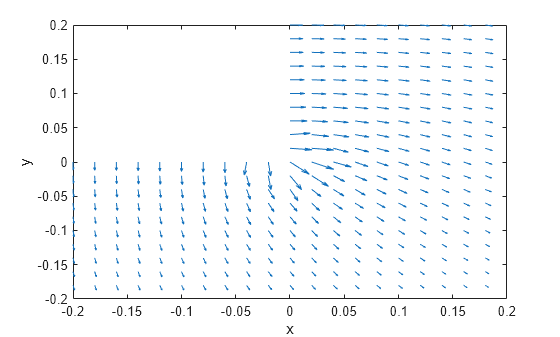
해의 기울기를 각 방향으로 -1에서 1까지의 그리드로 보간합니다. quiver를 사용하여 결과를 플로팅합니다.
[gradx,grady] = evaluateGradient(results,querypoints);
figure
quiver(X(:),Y(:),gradx,grady)
xlabel("x")
ylabel("y")
자세히 보기 위해 확대합니다. 예를 들어, 각 방향의 범위를 [-0.2,0.2]로 제한할 수 있습니다.
axis([-0.2 0.2 -0.2 0.2])
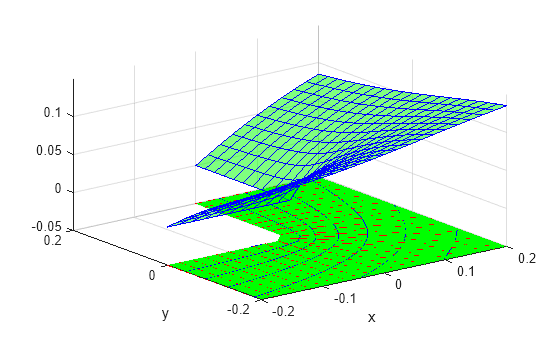
해와 그 기울기를 동일한 범위에서 플로팅합니다.
figure
h1 = meshc(X,Y,uintrp);
set(h1,FaceColor="g",EdgeColor="b")
xlabel("x")
ylabel("y")
alpha(0.5)
hold on

Z = -0.05*ones(size(X));
gradz = zeros(size(gradx));

h2 = quiver3(X(:),Y(:),Z(:),gradx,grady,gradz);
set(h2,Color="r")
axis([-0.2,0.2,-0.2,0.2])
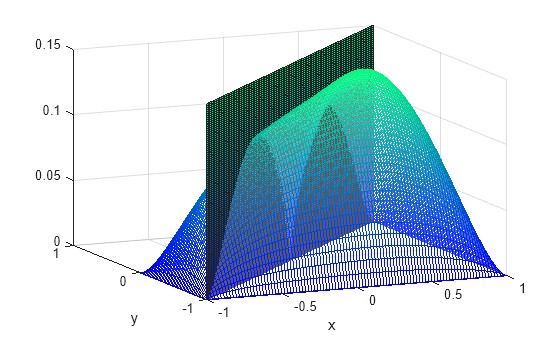
평면 x = y를 따라 해 플롯을 슬라이스합니다.
figure
mesh(X,Y,uintrp)
xlabel("x")
ylabel("y")
alpha(0.25)
hold on

z = linspace(0,0.15,101);
Z = meshgrid(z);
surf(X,X,Z')

view([-20 -45 15])
colormap winter
보간된 해를 평면을 따라 플로팅합니다.
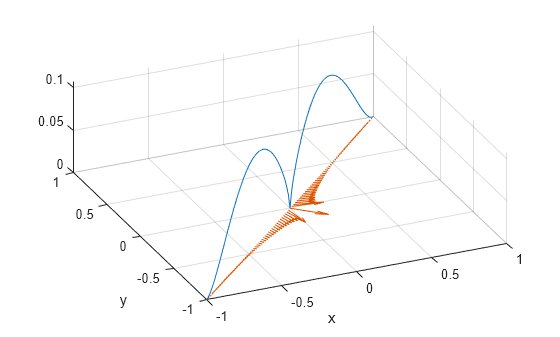
figure
xq = v;
yq = v;
uintrp = interpolateSolution(results,xq,yq);

plot3(xq,yq,uintrp)
grid on
xlabel("x")
ylabel("y")
동일한 평면을 따라 해의 기울기를 보간하고 해 플롯에 추가합니다.
[gradx,grady] = evaluateGradient(results,xq,yq);

gradx = reshape(gradx,size(xq));
grady = reshape(grady,size(yq));

hold on
quiver(xq,yq,gradx,grady)
view([-20 -45 75])