polyshape 기반의 지오메트리
이 예제에서는 MATLAB® polyshape 함수를 사용하여 다각형 지오메트리를 만드는 방법을 보여줍니다. 그런 다음 지오메트리의 삼각분할 표현을 사용하여 fegeometry 객체를 만듭니다.
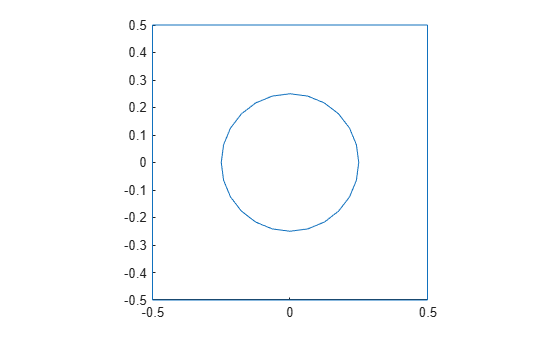
구멍이 있는 정사각형의 polyshape 객체를 만들고 플로팅합니다.
t = pi/12:pi/12:2*pi;
pgon = polyshape({[-0.5 -0.5 0.5 0.5], 0.25*cos(t)}, ...
                 {[0.5 -0.5 -0.5 0.5], 0.25*sin(t)})
pgon =
polyshape with properties:
Vertices: [29×2 double]
NumRegions: 1
NumHoles: 1
plot(pgon)
axis equal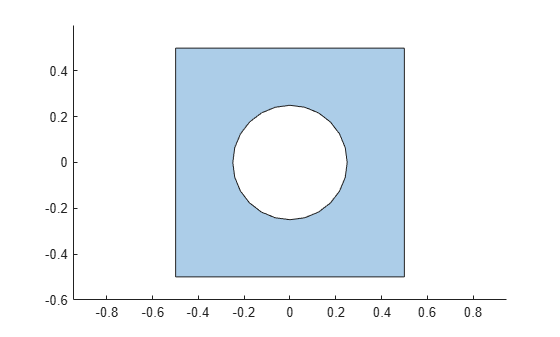
이 객체의 삼각분할 표현을 만듭니다.
tr = triangulation(pgon);
삼각분할 데이터를 사용하여 지오메트리를 만듭니다.
gm = fegeometry(tr)
gm =
  fegeometry with properties:

       NumCells: 0
       NumFaces: 1
       NumEdges: 5
    NumVertices: 5
       Vertices: [5×3 double]
           Mesh: [1×1 FEMesh]
지오메트리를 플로팅합니다.
pdegplot(gm);
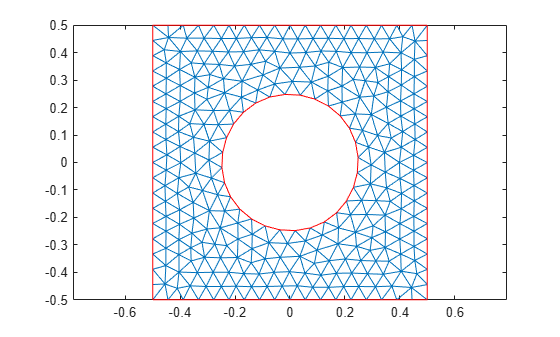
삼각분할 데이터가 낮은 품질의 선형 메시를 제공하므로, 추가 분석을 위해서는 촘촘한 새 메시를 생성합니다.
gm = generateMesh(gm);
gm.Mesh
ans =
  FEMesh with properties:

             Nodes: [2×1244 double]
          Elements: [6×572 double]
    MaxElementSize: 0.0566
    MinElementSize: 0.0283
     MeshGradation: 1.5000
    GeometricOrder: 'quadratic'
메시를 플로팅합니다.
pdemesh(gm);