Analyze MultiStart Optimization Results
Viewing and Selecting MultiStart Results
After you run your optimization, use the optimization output node to verify the results.
For general advice, see Analyze Point Optimization Results. This process describes
features specific to the results of MultiStart optimizations.
Optimizations using the MultiStart algorithm have multiple start
points and try to find multiple solutions per point. CAGE selects the best solution based on
the objective value. You can investigate all solutions and change selected solutions
manually if you want, for example to make smoother tables.
To examine MultiStart optimization results:
Click the Selected Solution button
 in the toolbar to see the optimal results selected by
CAGE in the Selected Solution table.
in the toolbar to see the optimal results selected by
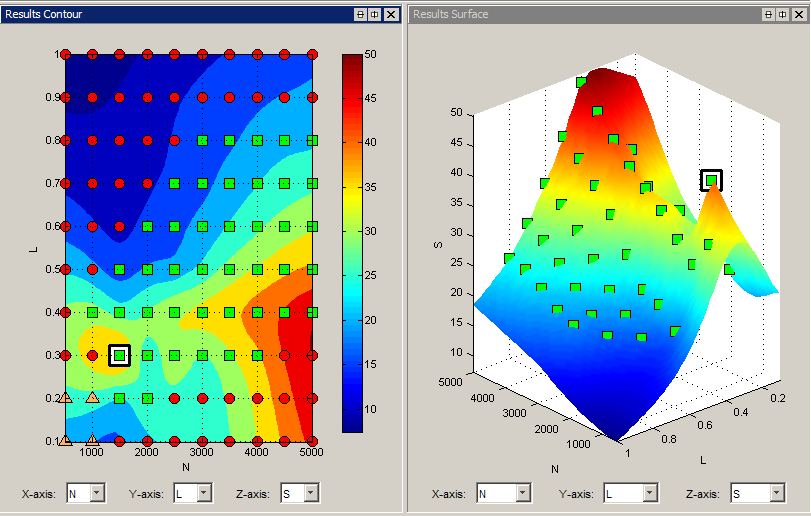
CAGE in the Selected Solution table.View your results in the Results Contour plot. Look for table areas that are not smooth enough.
You can also view the Results Surface at the same time by right-clicking the title bar and selecting Split View Horizontally.
Focus on runs that have accepted solutions (green squares) and then solutions that ran out of time (orange triangles). Red circles indicate failures to meet constraints with any of the start points (e.g., outside boundary model), so further analysis is less useful compared to the accepted solutions. For example, investigate green squares where the table is not very smooth.
Click the plots or table to select a point to investigate.
This example shows a selected point where the value of spark is too different from the neighboring points, which makes the table not smooth enough.
Click
 in the toolbar to switch to the Pareto Slice and view
all solutions at the selected point.
in the toolbar to switch to the Pareto Slice and view
all solutions at the selected point.This example shows
MultiStartresults as follows:CAGE sorts
MultiStartresults with the best solution at the top (solution 1).The number of solutions is not necessarily the same as the Number of start points. The example has five feasible solutions, and an additional row displaying
NANs. This means that CAGE found six different feasible solutions for at least one other run in this optimization. Ignore any rows withNANs. CAGE shows the same maximum number of solution rows for every run. If there are rows beyond the feasible solutions for the current run, then CAGE fills the rows withNANs.You can set the tolerance between different solutions with the Tolerance for separate solutions
MultiStartsetting.
Here, CAGE has selected the best solution with the optimal value of torque,
BTQ. In this case you can instead select another solution to make a smoother table in spark (S) with only a small tradeoff in the torque value.
Change the selected solution using the Selected solution control, or click the solution in the table and click Select Solution
 in the toolbar.
Return to the Selected Solution slice to view the difference in your table.
Repeat the process to investigate your other results.
Creating Sum Optimizations from MultiStart Optimizations
When you are satisfied with all selected solutions for your optimization, you can make a
sum optimization over all operating points. To create a sum optimization from your point
MultiStart optimization:
From your point optimization output node, select Solution > Create Sum Optimization.
The toolbox creates a sum optimization with your selected solution values defining the operating points. The create sum optimization function converts the
MultiStartoptimization to a standard single objective sum optimization (fminconalgorithm) and uses your accepted selected solutions for variable values.Add table gradient constraints to ensure smooth control and engine response.
See also Create Sum Optimization from Point Optimization Output.