주요 콘텐츠

nebula

네뷸라(Nebula) 컬러맵 배열

R2025a 이후

  • Nebula colormap

설명

c = nebula는 현재 Figure(gcf)의 컬러맵과 행 개수가 같은 3열 배열로 네뷸라(Nebula) 컬러맵을 반환합니다. Figure가 없는 경우 행 개수는 디폴트 길이인 256과 같습니다. 배열의 각 행에는 특정 색의 빨간색, 녹색, 파란색 농도가 포함되어 있습니다. 농도는 범위 [0, 1]의 값이며 색 체계는 아래 이미지와 같습니다.

Sample of the nebula colormap

예제

c = nebula(m)m개 색으로 구성된 컬러맵을 반환합니다.

예제

예제

모두 축소

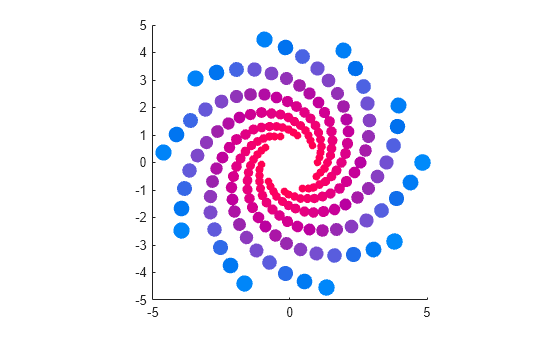
나선을 플로팅하고 nebula 컬러맵을 할당합니다.

numLoops = 20;
numPtsPerLoop = 196;
theta = linspace(0,numLoops*2*pi,numPtsPerLoop);
d = exp(0.25*theta/numLoops);
x = d.*cos(theta);
y = d.*sin(theta);
s = scatter(x,y,32*d,d,"filled");
axis square
colormap nebula

Figure contains an axes object. The axes object contains an object of type scatter.

nebula 컬러맵 배열을 가져오고, 순서를 반전합니다. 그런 다음 수정된 컬러맵을 나선에 적용합니다.

c = nebula;
c = flipud(c);
colormap(c);

Figure contains an axes object. The axes object contains an object of type scatter.

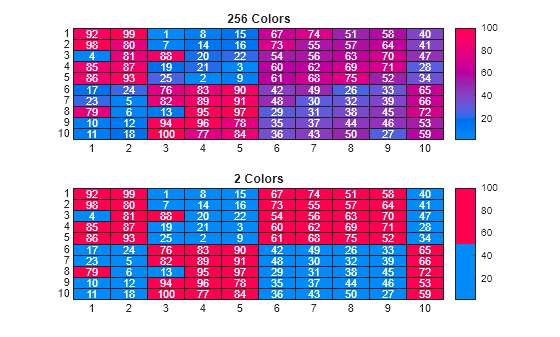
히트맵 차트는 기본적으로 sky 컬러맵의 256샘플링을 사용합니다. heatmap 함수의 Colormap 이름-값 인수를 지정하여 컬러맵과 샘플링을 변경할 수 있습니다.

예를 들어, 2×1 타일 형식 차트 레이아웃에 두 개의 히트맵 차트를 만들어 보겠습니다. 위쪽 차트는 nebula 컬러맵의 256개 색을 사용하고 아래쪽 차트는 2개의 색만 사용합니다.

tiledlayout(2,1)

% Top chart with default number of colors
nexttile
cdata = magic(10);
heatmap(cdata,Colormap=nebula)
title("256 Colors")

% Bottom chart with two colors
nexttile
heatmap(cdata,Colormap=nebula(2))
title("2 Colors")

Figure contains objects of type heatmap. The chart of type heatmap has title 256 Colors. The chart of type heatmap has title 2 Colors.

입력 인수

모두 축소

색 개수로, 음이 아닌 정수로 지정됩니다. m의 디폴트 값은 현재 Figure의 컬러맵에 있는 색 개수입니다. Figure가 없는 경우 디폴트 값은 256입니다.

데이터형: single | double | int8 | int16 | int32 | int64 | uint8 | uint16 | uint32 | uint64

버전 내역

R2025a에 개발됨