허프 변환(Hough Transform)
Image Processing Toolbox™는 허프 변환을 사용하여 영상에서 직선을 검출할 수 있는 함수를 지원합니다.
hough 함수는 표준 허프 변환(SHT)을 구현합니다. 허프 변환은 직선에 대한 파라미터 표현을 다음과 같이 사용하여 직선을 검출하도록 설계되어 있습니다.
rho = x*cos(theta) + y*sin(theta)
변수 rho는 원점에서 해당 직선에 수직인 벡터 상의 직선까지의 거리입니다. theta는 x축과 이 벡터 사이의 각도입니다. hough 함수는 행과 열이 각각 rho 값과 theta 값에 대응되는 파라미터 공간 행렬을 생성합니다.
허프 변환을 계산한 후에는 houghpeaks 함수를 사용하여 파라미터 공간의 피크 값을 구할 수 있습니다. 이들 피크가 입력 영상에서 직선일 가능성이 있는 부분을 나타냅니다.
허프 변환에서 피크를 식별한 후에는 houghlines 함수를 사용하여 허프 변환의 피크에 대응되는 선분의 끝점을 구할 수 있습니다. 이 함수는 자동으로 선분의 작은 간격을 메웁니다.
허프를 사용하여 영상에서 직선 검출하기
이 예제에서는 Hough 변환을 사용하여 영상에서 직선을 검출하는 방법을 보여줍니다.
영상을 작업 공간으로 읽어 들이고, 이 예제의 설명을 돕기 위해 영상을 회전합니다. 영상을 표시합니다.
I = imread('circuit.tif');
rotI = imrotate(I,33,'crop');
imshow(rotI)

edge 함수를 사용하여 영상에서 경계를 찾습니다.
BW = edge(rotI,'canny');
imshow(BW);
edge에서 반환한 이진 영상에 대해 허프 변환을 계산합니다.
[H,theta,rho] = hough(BW);
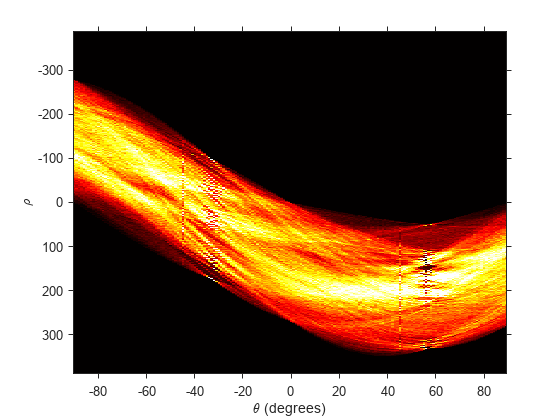
hough 함수에서 반환한 변환 H를 표시합니다.
figure
imshow(imadjust(rescale(H)),[],...
       'XData',theta,...
       'YData',rho,...
       'InitialMagnification','fit');
xlabel('\theta (degrees)')
ylabel('\rho')
axis on
axis normal
hold on
colormap(gca,hot)

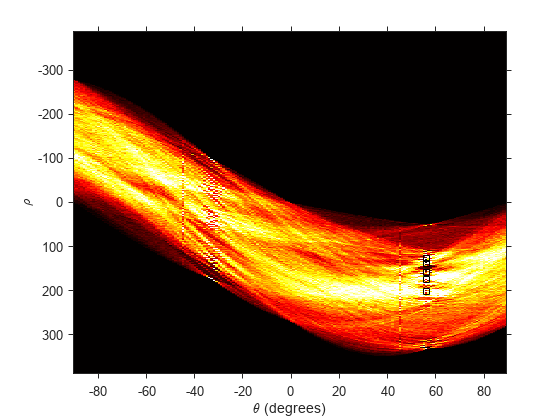
houghpeaks 함수를 사용하여 허프 변환 행렬 H에서 피크를 찾습니다.
P = houghpeaks(H,5,'threshold',ceil(0.3*max(H(:))));변환 영상 위에 피크를 나타내는 플롯을 겹쳐 놓습니다.
x = theta(P(:,2));
y = rho(P(:,1));
plot(x,y,'s','color','black');

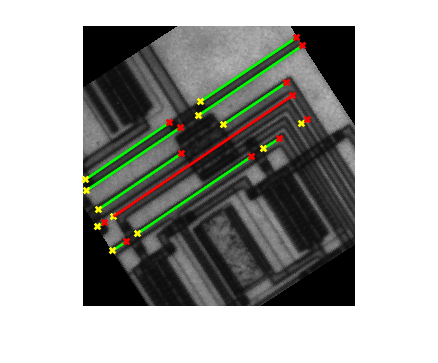
houghlines 함수를 사용하여 영상에서 직선을 찾습니다.
lines = houghlines(BW,theta,rho,P,'FillGap',5,'MinLength',7);
원본 영상과 그 위에 직선을 겹쳐 표시하는 플롯을 만듭니다.
figure, imshow(rotI), hold on
max_len = 0;
for k = 1:length(lines)
   xy = [lines(k).point1; lines(k).point2];
   plot(xy(:,1),xy(:,2),'LineWidth',2,'Color','green');

   % Plot beginnings and ends of lines
   plot(xy(1,1),xy(1,2),'x','LineWidth',2,'Color','yellow');
   plot(xy(2,1),xy(2,2),'x','LineWidth',2,'Color','red');

   % Determine the endpoints of the longest line segment
   len = norm(lines(k).point1 - lines(k).point2);
   if ( len > max_len)
      max_len = len;
      xy_long = xy;
   end
end
% highlight the longest line segment
plot(xy_long(:,1),xy_long(:,2),'LineWidth',2,'Color','red');
