spectrumoptions
Option set for spectrumplot
Description
opt = spectrumoptionsspectrumplot. Use
dot notation to customize the option set, if needed.
opt = spectrumoptions('identpref')
Examples
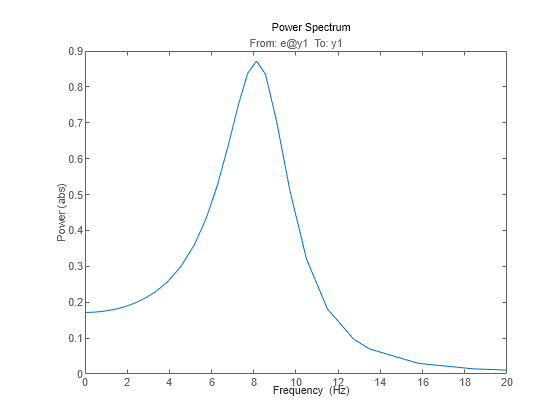
Specify the plot options.
plot_options = spectrumoptions;
plot_options.FreqUnits = 'Hz';
plot_options.FreqScale = 'linear';
plot_options.Xlim = {[0 20]};
plot_options.MagUnits = 'abs';
Estimate an AR model.
load iddata9 z9
sys = ar(z9,4);
Plot the output spectrum for the model.
spectrumplot(sys,plot_options);
opt = spectrumoptions('identpref');Output Arguments
Option set containing the specified options for spectrumplot.
| Field | Description |
|---|---|
|
Text and style for axes labels and plot title, specified as a structure array with the following fields:
|
TickLabel |
Tick label style, specified as a structure array with the following fields:
|
Grid |
Show or hide the grid, specified as one of the
following values: Default:
|
GridColor |
Color of the grid lines, specified as one of the
following: vector of RGB values in the range
Default:
|
XLimMode, YLimMode |
Axes limit modes, specified as one of the following values:
Default:
|
XLim, YLim | Axes limits, specified as an array of the form [min,max] |
IOGrouping |
Grouping of input-output pairs in the plot,
specified as one of the following values:
Default:
|
InputLabels, OutputLabels |
Input and output label styles, specified as a structure array with the following fields:
|
InputVisible, OutputVisible |
Visibility of input and output channels, specified
as one of the following values:
Default:
|
ConfidenceRegionNumberSD |
Number of standard deviations to use to plot the response confidence region. Default:
|
FreqUnits | Frequency units, specified as one of the following values:
Default: You
can also specify |
FreqScale |
Frequency scale, specified as one of the following
values: Default:
|
MagUnits |
Magnitude units, specified as one of the following
values: Default:
|
MagScale |
Magnitude scale, specified as one of the following
values: Default:
|
MagLowerLimMode |
Enables a lower magnitude limit, specified as one
of the following values: Default:
|
MagLowerLim | Lower magnitude limit, specified as data type double. |
Version History
Introduced in R2012a
See Also
MATLAB Command
You clicked a link that corresponds to this MATLAB command:
Run the command by entering it in the MATLAB Command Window. Web browsers do not support MATLAB commands.
웹사이트 선택
번역된 콘텐츠를 보고 지역별 이벤트와 혜택을 살펴보려면 웹사이트를 선택하십시오. 현재 계신 지역에 따라 다음 웹사이트를 권장합니다:
또한 다음 목록에서 웹사이트를 선택하실 수도 있습니다.
사이트 성능 최적화 방법
최고의 사이트 성능을 위해 중국 사이트(중국어 또는 영어)를 선택하십시오. 현재 계신 지역에서는 다른 국가의 MathWorks 사이트 방문이 최적화되지 않았습니다.
미주
- América Latina (Español)
- Canada (English)
- United States (English)
유럽
- Belgium (English)
- Denmark (English)
- Deutschland (Deutsch)
- España (Español)
- Finland (English)
- France (Français)
- Ireland (English)
- Italia (Italiano)
- Luxembourg (English)
- Netherlands (English)
- Norway (English)
- Österreich (Deutsch)
- Portugal (English)
- Sweden (English)
- Switzerland
- United Kingdom (English)