idnlarx/plot
(Not recommended) Plot nonlinearity of nonlinear ARX model
idnlarx/plot is not recommended. Use nlarxPlot instead to plot nonlinear ARX model nonlinearities. For more
information, see Version History.
Syntax
Description
plot( plots the nonlinearity
of a nonlinear ARX model on a nonlinear ARX plot.
The plot shows the nonlinearity for all outputs of the model as a function of
its input regressors.model)
plot(model1,...,modelN) generates the plot for multiple
models.
plot(model1,color1...,modelN,colorN) specifies the color
for each model. You do not need to specify the color for all models.
Examples
Input Arguments
More About
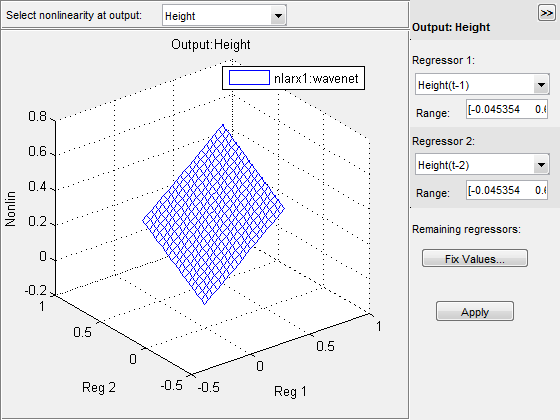
A nonlinear ARX plot displays the evaluated model nonlinearity for a chosen
model output as a function of one or two model regressors. For a model M,
the model nonlinearity (M.Nonlinearity) is a nonlinearity estimator
function, such as idWaveletNetwork, idSigmoidNetwork, or idTreePartition, that uses model regressors as
its inputs.
To understand what is plotted, suppose that {r1,r2,…,rN} are
the N regressors used by a nonlinear ARX model M with
nonlinearity nl corresponding to a model output.
You can use getreg(M) to view these regressors.
The expression Nonlin = evaluate(nl,[v1,v2,...,vN]) returns
the model output for given values of these regressors, that is, r1 = v1, r2 = v2,
..., rN = vN. For plotting the
nonlinearities, you select one or two of the N regressors,
for example, rsub = {r1,r4}. The software varies
the values of these regressors in a specified range, while fixing
the value of the remaining regressors, and generates the plot of Nonlin vs. rsub.
By default, the software sets the values of the remaining fixed regressors
to their estimated means, but you can change these values. The regressor
means are stored in the Nonlinearity.Parameters.RegressorMean property
of the model.
Examining a nonlinear ARX plot can help you gain insight into which regressors have the strongest effect on the model output. Understanding the relative importance of the regressors on the output can help you decide which regressors to include in the nonlinear function for that output. If the shape of the plot looks like a plane for all the chosen regressor values, then the model is probably linear in those regressors. In this case, you can remove the corresponding regressors from nonlinear block, and repeat the estimation.
Furthermore, you can create several nonlinear models for the same data using different
nonlinearity estimators, such a idWaveletNetwork network and
idTreePartition, and then compare the nonlinear surfaces of these
models. Agreement between plots for various models increases the confidence that these
nonlinear models capture the true dynamics of the system.
To learn more about configuring the plot, see Configuring a Nonlinear ARX Plot.