Debug Numerical Issues in Fixed-Point Conversion Using Variable Logging
This example shows some best practices for debugging your fixed-point code when you need more than out of the box conversion.
Prerequisites
Create a local working folder, for example,
c:\kalman_filter.In your local working folder, create the following files.
Convert to Fixed Point Using Default Configuration
From the apps gallery, open the Fixed-Point Converter app.
On the Select page, browse to the
kalman_filter.mfile and click Open.Click Next. On the Define Input Types page, browse to the
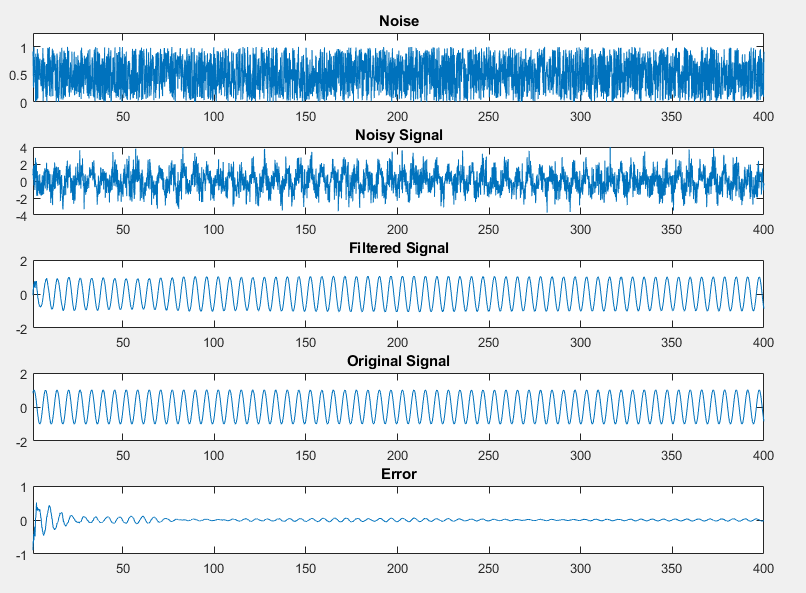
kalman_filter_tbfile. Click Autodefine Input Types.The test file runs and plots the input noisy signal, the filtered signal, the ideal filtered signal, and the difference between the filtered and the ideal filtered signal.
Click Next. On the Convert to Fixed Point page, click Analyze to gather range information and data type proposals using the default settings.
Click Convert to apply the proposed data types.
Click the Test arrow and select the Log inputs and outputs for comparison plots check box. Click Test. The Fixed-Point Converter runs the test file
kalman_filter_tb.mto test the generated fixed-point code. Floating-point and fixed-point simulations are run, with errors calculated for the input and output variables.The generated plots show that the current fixed-point implementation does not produce good results.
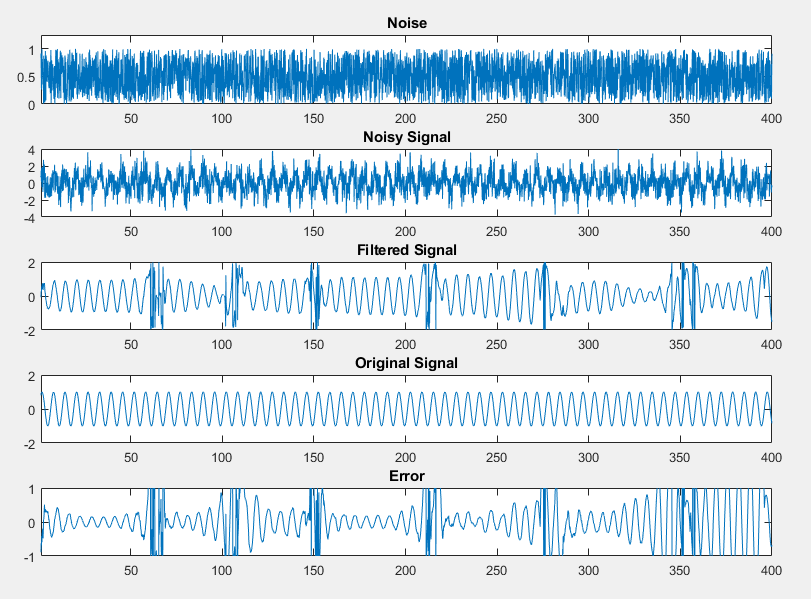
The error for the output variable
yis extremely high, at over 282 percent.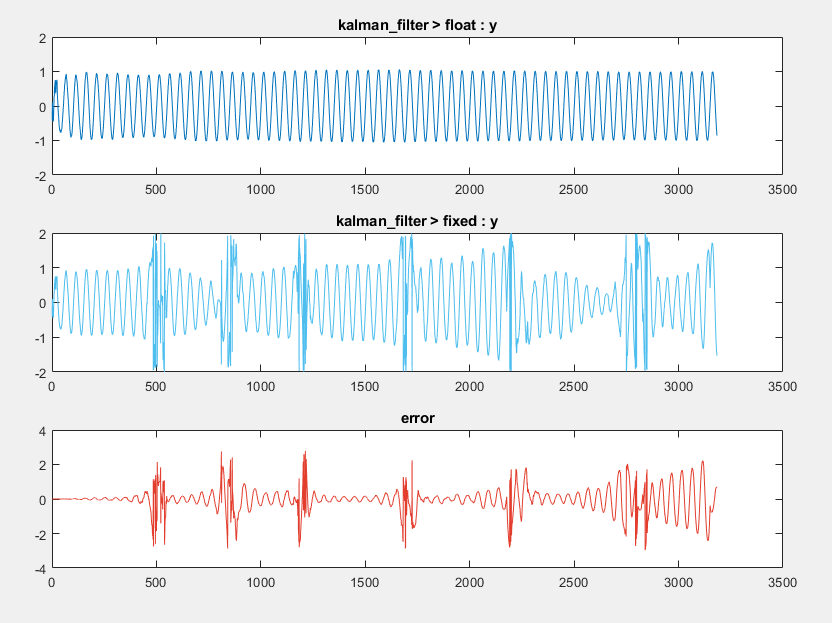
Determine Where Numerical Issues Originated
Log any function input and output variables that you suspect are the cause of numerical issues to the output arguments of the top-level function.
Click
kalman_filterin the Source Code pane to return to the floating-point code.When you select the Log inputs and outputs for comparison plots option during the Test phase, the input and output variables of the top level-function,
kalman_filterare automatically logged for plotting.The
kalman_filterfunction calls thematrix_solvefunction, which contains calls to several other functions. To investigate whether numerical issues are originating in thematrix_solvefunction, selectkalman_filter>matrix_solvein the Source Code pane.In the Log Data column, select the function input and output variables that you want to log. In this example, select all three,
a,b, andx.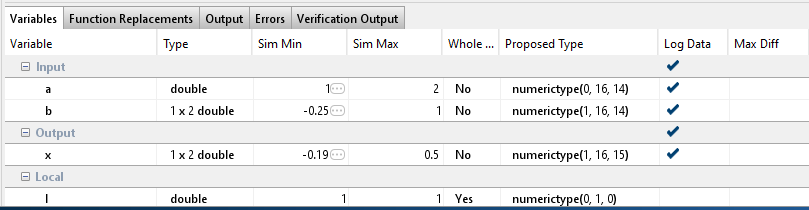
Click Test.
The generated plot shows a large error for the output variable of the
matrix_solvefunction.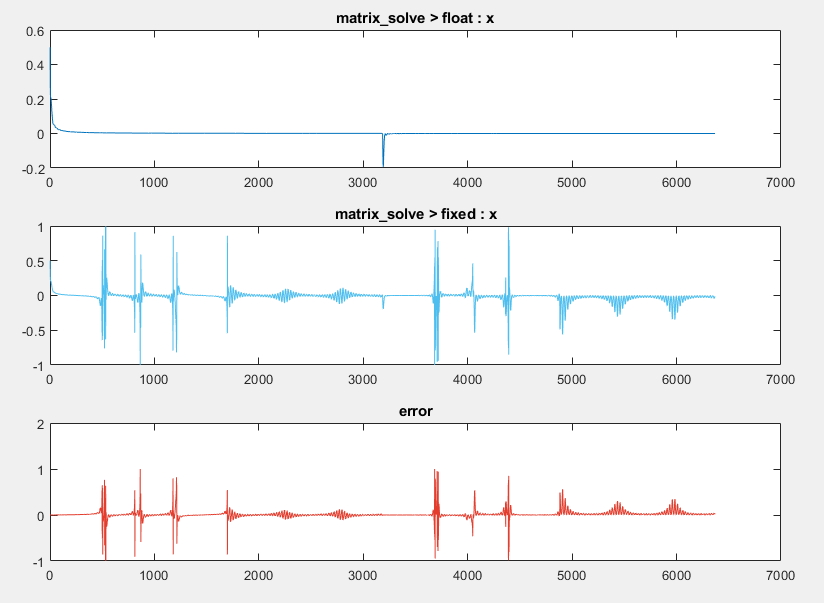
Adjust fimath Settings
On the Convert to Fixed Point page, click Settings.
Under fimath, set the Rounding method to
Nearest. Set the Overflow action toSaturate.Click Convert to apply the new settings.
Click the arrow next to Test and ensure that Log inputs and outputs for comparison plots is selected. Enable logging for any function input or output variables. Click Test.
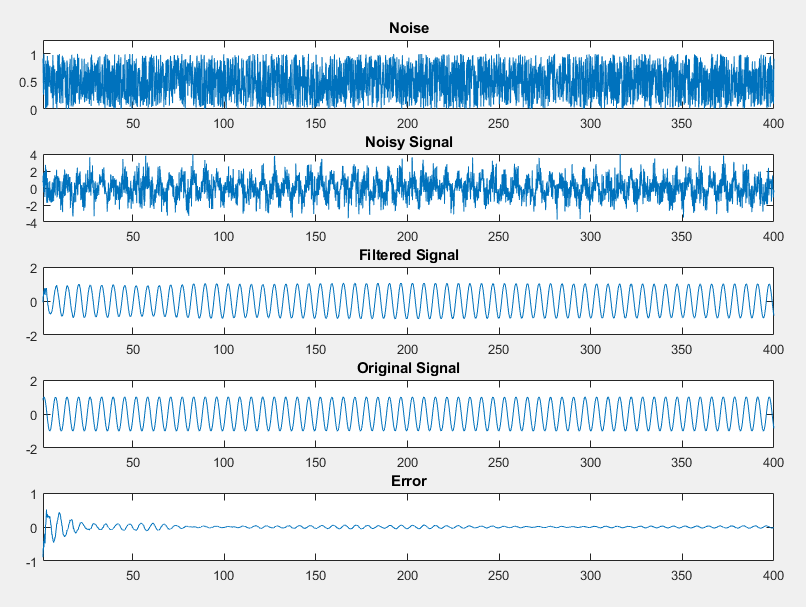
Examine the plot for top-level function output variable,
y.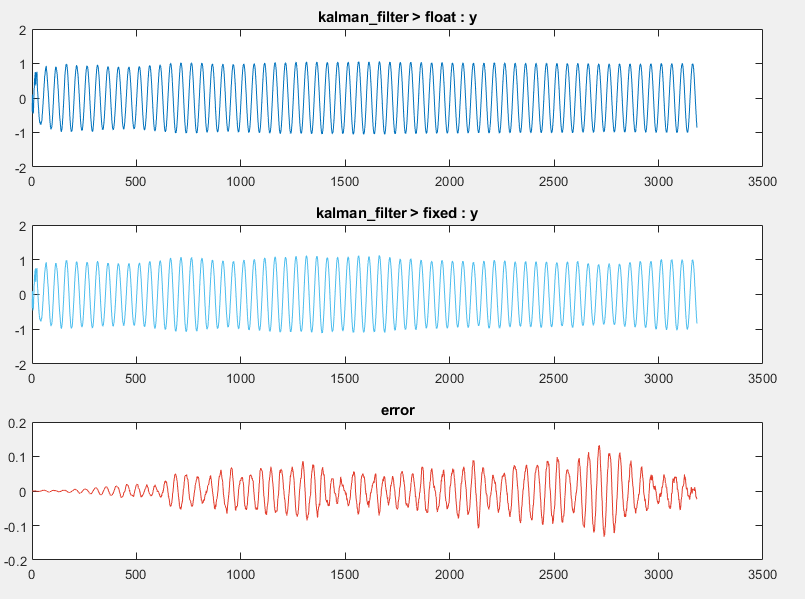
The new
fimathsettings improve the output, but some error still remains.
Adjust Word Length Settings
Adjusting the default word length improves the accuracy of the generated fixed-point design.
Click Settings and change the default word length to
32. Click Convert to apply the new settings.Click Test. The error for the output variable
yis accumulating.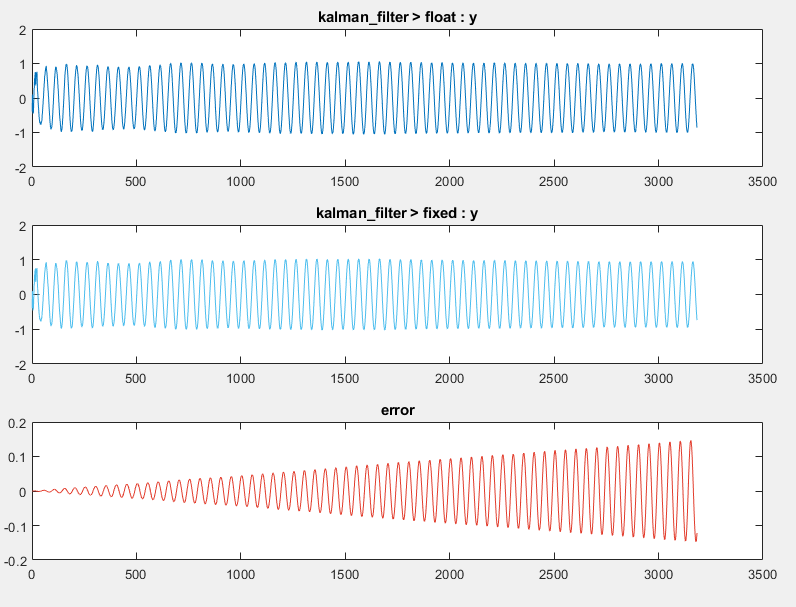
Close the Fixed-Point Converter and plot window.
Replace Constant Functions
The kalman_stm function computes the state transition matrix, which
is a constant. You do not need to convert this function to fixed point. To avoid
unnecessary quantization through computation, replace this function with a
double-precision constant. By replacing the function with a constant, the state
transition matrix undergoes quantization only once.
Click the
kalman_filterfunction in the Source Code pane. Edit thekalman_filterfunction. Replace the call to thekalman_stmfunction with the equivalent double constant.Save the changes.A = [0.992114701314478, -0.125333233564304; 0.125333233564304, 0.992114701314478];Click Analyze to refresh the proposals.
Click Convert to apply the new proposals.
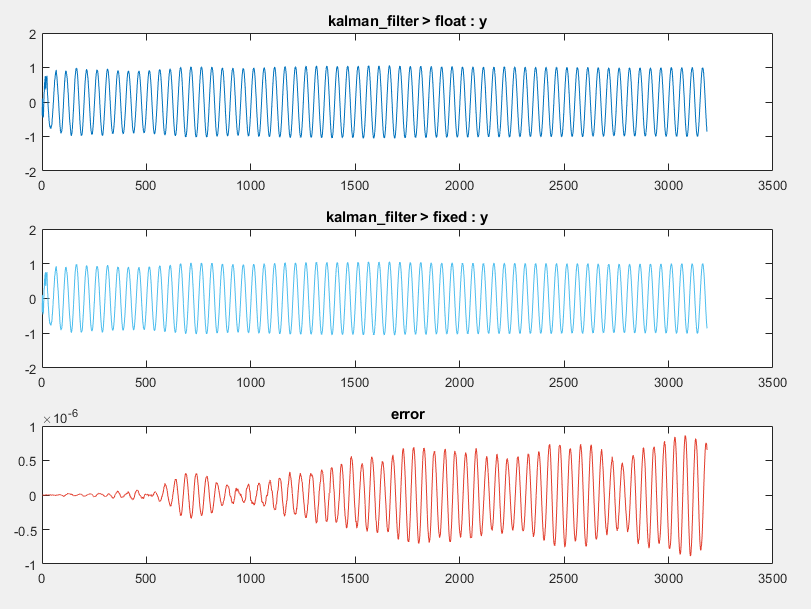
Click Test. The error on the plot for the functions output
yis now on the order of 10-6, which is acceptable for this design.