bollinger
Time series Bollinger band
Description
[
calculates the middle, upper, and lower bands that make up the Bollinger bands from a series
of data. A Bollinger band chart plots actual asset data along with
three other bands of data: the upper band that is two standard deviations above a
user-specified moving average; the lower band that is two standard deviations below that
moving average; and the middle band that is the moving average itself.middle,upper,lower] = bollinger(Data)
[
adds optional name-value pair arguments. middle,upper,lower] = bollinger(___,Name,Value)
Examples
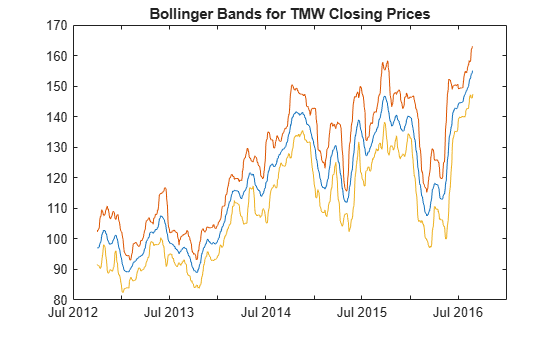
Load the file SimulatedStock.mat, which provides a timetable (TMW) for financial data for TMW stock.
load SimulatedStock.mat
[middle,upper,lower]= bollinger(TMW);
CloseBolling = [middle.Close, upper.Close,...
lower.Close];
plot(middle.Time,CloseBolling)
title('Bollinger Bands for TMW Closing Prices')
Input Arguments
Name-Value Arguments
Output Arguments
More About
References
[1] Achelis, S. B. Technical Analysis from A to Z. Second Edition. McGraw-Hill, 1995, pp. 72–74.