Compare Recession Indicators
Load the Data_RecessionIndicators.mat data set, provided by Haver Analytics, which contains various indicators of business cycle turning points.
load Data_RecessionIndicatorsThe variables DataTable and dates, among others, appear in the workspace. For more details on the data, enter Description.
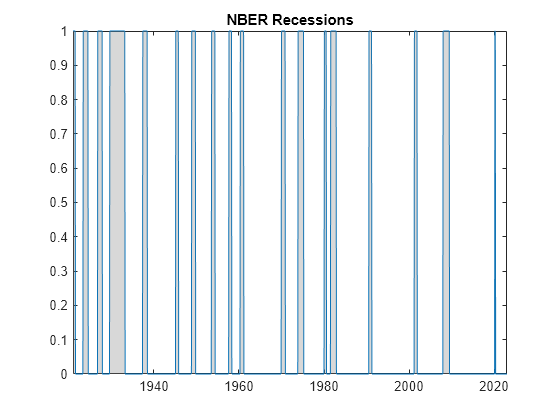
The first indicator in DataTable, NBER, is the characteristic function for the subset of monthly dates delimiting NBER-acknowledged recession periods.
Plot the NBER recession indicator series and overlay recession bands.
plot(dates,DataTable.NBER)
recessionplot
title("NBER Recessions")
recessionplot uses this indicator to determine the recession bands.
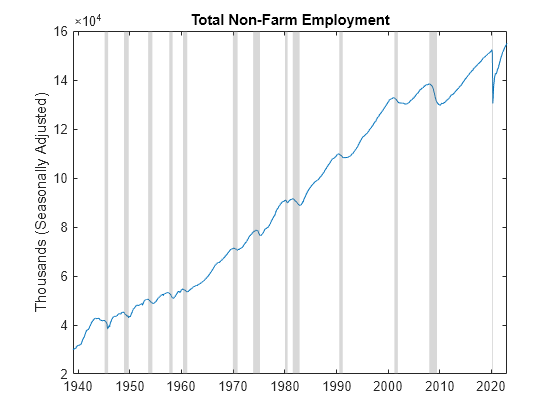
The second indicator in DataTable, EMPLOY, is total employment in non-farm industries reported by the Bureau of Labor Statistics. It is one of the principal macroeconomic series used by NBER to determine recession periods.
Plot the total employment in non-farm industries series and overlay recession bands.
plot(dates,DataTable.EMPLOY)
recessionplot
ylabel("Thousands (Seasonally Adjusted)")
title("Total Non-Farm Employment")

Turning points in this indicator closely track the NBER-determined recession bands.
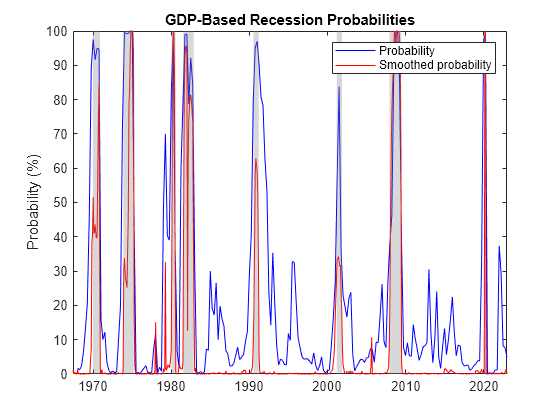
The final two indicators in DataTable, GDP and SMOOTH, are GDP-based probabilities of recession reported by the Federal Reserve.
Plot both GDP-based recession probabilities series and overlay recession bands.
idx = ~isnan(DataTable.GDP); % Index non-NaN data in disaggregated quarterly series

plot(dates(idx),DataTable.GDP(idx),"b",dates,DataTable.SMOOTH,"r")
recessionplot
ylabel("Probability (%)")
title("GDP-Based Recession Probabilities")
legend("Probability","Smoothed probability")

The peaks in these indicators also closely track the NBER-determined recession bands.