plotresponse
동적 신경망 시계열 응답 플로팅
구문
plotresponse(t,y)

plotresponse(t1,'name',t2,'name2',...,y)

plotresponse(...,'outputIndex',outputIndex)
설명
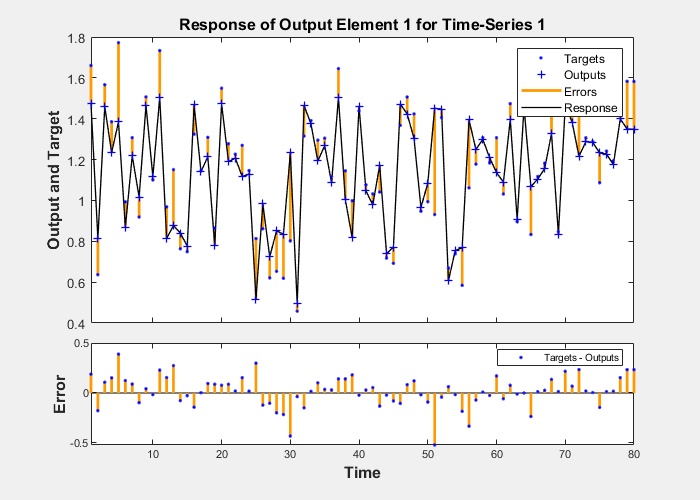
plotresponse(t,y)는 목표 시계열 t와 출력 시계열 y를 받아 같은 축에 플로팅하여 이 둘 사이의 오차를 표시합니다.
plotresponse(t1,'name',t2,'name2',...,y)는 여러 개의 목표값/이름 쌍을 받으며, 일반적으로 훈련 목표값, 검증 목표값, 테스트 목표값, 출력값을 정의합니다. 응답을 여러 색으로 플로팅하여 각기 다른 목표 세트임을 나타냅니다.
plotresponse(...,'outputIndex',outputIndex)는 선택적으로 어떤 오차 요소가 상관관계가 있고 플로팅되는지 정의합니다. 디폴트 값은 1입니다.
예제
목표 및 출력 시계열 데이터 플로팅하기
이 예제에서는 NARX 신경망을 사용하여 시계열 문제를 푸는 방법을 보여줍니다.
[X,T] = simplenarx_dataset;
net = narxnet(1:2,20);
[Xs,Xi,Ai,Ts] = preparets(net,X,{},T);
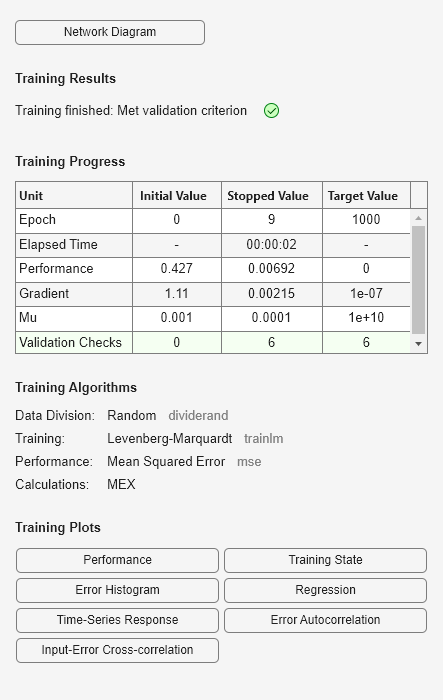
net = train(net,Xs,Ts,Xi,Ai);
Y = net(Xs,Xi,Ai);
plotresponse(Ts,Y)

버전 내역
R2010b에 개발됨