이 페이지는 기계 번역을 사용하여 번역되었습니다. 최신 내용을 영문으로 보려면 여기를 클릭하십시오.
연속 오디오 데이터 수집
R2026a이 예제에서는 마이크를 사용하여 연속 오디오 수집을 설정하는 방법을 보여줍니다.
DataAcquisition 객체 생성하기
공급업체로 directsound를 지정하여 DataAcquisition 객체를 생성하고 addinput를 사용하여 오디오 입력 채널을 추가합니다.
dq = daq("directsound");
addinput(dq,"Audio0",1,"Audio");
FFT 플롯 설정
hf = figure;
hp = plot(zeros(1000,1));
T = title('Discrete FFT Plot');
xlabel('Frequency (Hz)')
ylabel('|Y(f)|')
grid on;
ScansAvailableFcn 설정하기
ScansAvailableFcn을 설정하여 라이브 입력 신호의 FFT로 Figure를 업데이트합니다.
dq.ScansAvailableFcn = @(src, evt) continuousFFT(src, hp);
수집 시작하기
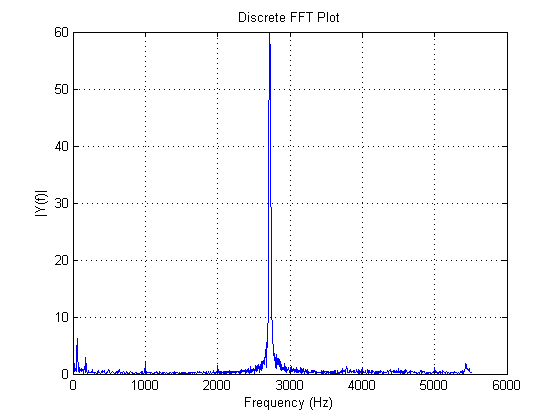
마이크를 사용하면 10초 동안 Figure가 업데이트됩니다.
start(dq,"Duration",seconds(10));
figure(hf);
function continuousFFT(daqHandle, plotHandle)
% Calculate FFT(data) and update plot with it.
data = read(daqHandle, daqHandle.ScansAvailableFcnCount, "OutputFormat", "Matrix");
Fs = daqHandle.Rate;

lengthOfData = length(data);
% next closest power of 2 to the length
nextPowerOfTwo = 2 ^ nextpow2(lengthOfData);

plotScaleFactor = 4;
% plot is symmetric about n/2
plotRange = nextPowerOfTwo / 2;
plotRange = floor(plotRange / plotScaleFactor);

yDFT = fft(data, nextPowerOfTwo);

h = yDFT(1:plotRange);
abs_h = abs(h);

% Frequency range
freqRange = (0:nextPowerOfTwo-1) * (Fs / nextPowerOfTwo);
% Only plot up to n/2 (as other half is the mirror image)
gfreq = freqRange(1:plotRange);

% Update the plot
set(plotHandle, 'ydata', abs_h, 'xdata', gfreq);
drawnow
end

