ssbmod
단측파대 억압 반송파 진폭 변조
설명
예제
샘플 레이트를 100Hz로 설정합니다. 100초 길이의 시간 벡터를 만듭니다.
fs = 100;
t = (0:1/fs:100)';
반송 주파수를 10Hz로 설정합니다. 정현파 신호를 생성합니다.
fc = 10;
x = sin(2*pi*t);
단측파대 및 양측파대 AM을 사용하여 x를 변조합니다.
doubleY = ammod(x,fc,fs);
singleY = ssbmod(x,fc,fs);
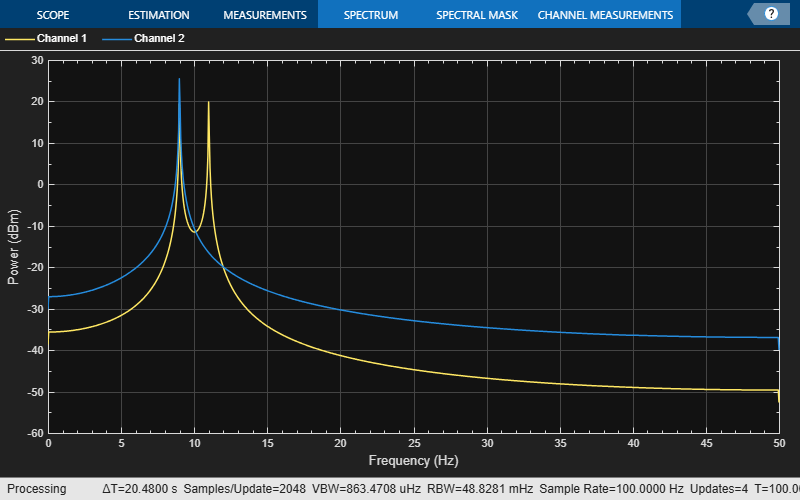
spectrum analyzer 객체를 만들어 신호의 스펙트럼을 플로팅합니다.
sadsb = spectrumAnalyzer( ...
    SampleRate=fs, ...
    PlotAsTwoSidedSpectrum=false, ...
    YLimits=[-60 30]);
sadsb(doubleY,singleY)
입력 인수
출력 인수
버전 내역
R2006a 이전에 개발됨