cghfreqplot
Display frequency of DNA copy number alterations across multiple samples
Syntax
FreqStruct = cghfreqplot(CGHData)


FreqStruct = cghfreqplot(CGHData,
...'Threshold', ThresholdValue, ...)

FreqStruct = cghfreqplot(CGHData,
...'Group', GroupValue, ...)

FreqStruct = cghfreqplot(CGHData,
...'Subgrp', SubgrpValue, ...)

FreqStruct = cghfreqplot(CGHData,
...'Subplot', SubplotValue, ...)

FreqStruct = cghfreqplot(CGHData,
...'Cutoff', CutoffValue, ...)

FreqStruct = cghfreqplot(CGHData,
...'Chromosome', ChromosomeValue, ...)

FreqStruct = cghfreqplot(CGHData,
...'IncludeX', IncludeXValue, ...)

FreqStruct = cghfreqplot(CGHData,
...'IncludeY', IncludeYValue, ...)

FreqStruct = cghfreqplot(CGHData,
...'Chrominfo', ChrominfoValue, ...)

FreqStruct = cghfreqplot(CGHData,
...'ShowCentr', ShowCentrValue, ...)

FreqStruct = cghfreqplot(CGHData,
...'Color', ColorValue, ...)

FreqStruct = cghfreqplot(CGHData,
...'YLim', YLimValue, ...)

FreqStruct = cghfreqplot(CGHData,
...'Titles', TitlesValue, ...)
Input Arguments
CGHData | Array-based comparative genomic hybridization (aCGH) data in either of the following forms:
|
ThresholdValue | Positive scalar or vector that specifies the gain/loss
threshold. A clone is considered to be a gain if its log2 ratio
is above The
Default is |
GroupValue | Specifies the sample groups to calculate the frequency from. Choices are:
Default is a single group of all the samples
in |
SubgrpValue | Controls the analysis of samples by subgroups. Choices are true (default)
or false. |
SubplotValue | Controls the display of all plots in one Figure window when
more than one subgroup is analyzed. Choices are true (default)
or false (displays plots in separate windows). |
CutoffValue | Scalar or two-element numeric vector that specifies a cutoff,
which controls the plotting of only the clones with frequency gains
or losses greater than or equal to CutoffValue.
If a two-element vector, the first element is the cutoff for gains,
and the second element is for losses. Default is 0. |
ChromosomeValue | Single chromosome number or a vector of chromosome numbers
that specify the chromosomes for which to display frequency plots.
Default is all chromosomes in CGHData. |
IncludeXValue | Controls the inclusion of the X chromosome in the analysis.
Choices are true (default) or false. |
IncludeYValue | Controls the inclusion of the Y chromosome in the analysis.
Choices are true or false (default)
. |
ChrominfoValue | Cytogenetic banding information specified by either of the following:
Default is Homo sapiens
cytogenetic banding information from the UCSC Genome Browser,
NCBI Build 36.1 ( |
ShowCentrValue | Controls the display of the centromere positions as vertical
dashed lines in the frequency plot. Choices are Tip The centromere positions are obtained from |
ColorValue | Color scheme for the vertical lines in the plot, indicating the frequency of the gains and losses, specified by either of the following:
The default color scheme is a range of colors from pure green (gain = 1) through yellow (0) to pure red (loss = –1). |
YLimValue | Two-element vector specifying the minimum and maximum values
on the vertical axis. Default is [1, -1]. |
TitlesValue | Character vector, string, string vector, or a cell array of character vectors that specifies titles for the group(s), which are added to the tops of the plot(s). |
Output Arguments
FreqStruct | Structure containing frequency data in the following fields:
Tip You can use this output structure as input to the |
Description
FreqStruct = cghfreqplot(CGHData)
FreqStruct = cghfreqplot(CGHData,
...'PropertyName', PropertyValue,
...)cghfreqplot with optional
properties that use property name/property value pairs. You can specify
one or more properties in any order. Each PropertyName must
be enclosed in single quotation marks and is case insensitive. These
property name/property value pairs are as follows:
specifies
the gain/loss threshold. A clone is considered to be a gain if its
log2 ratio is above FreqStruct = cghfreqplot(CGHData,
...'Threshold', ThresholdValue, ...)ThresholdValue,
and a loss if its log2 ratio is below negative ThresholdValue.
The ThresholdValue is applied as
follows:
If a positive scalar, it is the gain and loss threshold for all the samples.
If a two-element vector, the first element is the gain threshold for all samples, and the second element is the loss threshold for all samples.
If a vector of the same length as the number of samples, each element in the vector is considered as a unique gain and loss threshold for each sample.
Default is 0.25.
FreqStruct = cghfreqplot(CGHData,
...'Group', GroupValue, ...)
A vector of sample column indices (for data with only one group). The samples specified in the vector are considered a group.
A cell array of vectors of sample column indices (for data divided into multiple groups). Each element in the cell array is considered a group.
Default is a single group of all the samples in CGHData.
FreqStruct = cghfreqplot(CGHData,
...'Subgrp', SubgrpValue, ...)true (default)
or false.
FreqStruct = cghfreqplot(CGHData,
...'Subplot', SubplotValue, ...)true (default) or false (displays
plots in separate windows).
FreqStruct = cghfreqplot(CGHData,
...'Cutoff', CutoffValue, ...)CutoffValue. CutoffValue is
a scalar or two-element numeric vector. If a two-element numeric vector,
the first element is the cutoff for gains, and the second element
is for losses. Default is 0.
FreqStruct = cghfreqplot(CGHData,
...'Chromosome', ChromosomeValue, ...)ChromosomeValue,
which can be a single chromosome number or a vector of chromosome
numbers. Default is all chromosomes in CGHData.
FreqStruct = cghfreqplot(CGHData,
...'IncludeX', IncludeXValue, ...)true (default)
or false.
FreqStruct = cghfreqplot(CGHData,
...'IncludeY', IncludeYValue, ...)true or false (default).
FreqStruct = cghfreqplot(CGHData,
...'Chrominfo', ChrominfoValue, ...)ChrominfoValue can
be either of the following
Structure returned by the
cytobandreadfunctionCharacter vector or string specifying the file name of an NCBI ideogram text file or a UCSC Genome Browser cytoband text file
Default is Homo sapiens cytogenetic banding information from the UCSC
Genome Browser, NCBI Build 36.1 (https://genome.UCSC.edu).
Tip
You can download files containing cytogenetic G-banding data from the NCBI or UCSC Genome
Browser web site. For example, you can download the cytogenetic banding data
(cytoBandIdeo.txt.gz) for Homo sapiens
from:
FreqStruct = cghfreqplot(CGHData,
...'ShowCentr', ShowCentrValue, ...)true (default)
or false.
Tip
The centromere positions are obtained from ChrominfoValue.
FreqStruct = cghfreqplot(CGHData,
...'Color', ColorValue, ...)
Name of or handle to a function that returns a colormap.
M-by-3 matrix containing RGB values. If M equals 1, then that single color is used for all gains and losses. If M equals 2 or more, then the first row is used for gains, the second row is used for losses, and remaining rows are ignored. For example,
[0
1 0;1 0 0]
specifies green for gain and red for loss.
The default color scheme is a range of colors from pure green (gain = 1) through yellow (0) to pure red (loss = –1).
FreqStruct = cghfreqplot(CGHData,
...'YLim', YLimValue, ...)YLimValue is
a two-element vector specifying the minimum and maximum values on
the vertical axis. Default is [1, -1].
FreqStruct = cghfreqplot(CGHData,
...'Titles', TitlesValue, ...)TitlesValue can be a character vector, string, string
vector, or a cell array of character vectors.
Examples
Plot data from the Coriell cell line study
Load the array-based CGH (aCGH) data from the Coriell cell line study (Snijders, A. et al., 2001).
load coriell_baccghDisplay a frequency plot of the copy number alterations across all samples.
Struct = cghfreqplot(coriell_data);

View data tips for the data, chromosomes, and centromeres. First click the Data Cursor button on the toolbar, then click the black chromosome boundary line, or a dotted centromere line in the plot. To delete this data tip, right-click it, then select Delete Current Datatip.
Display a color bar indicating the degree of gain or loss by clicking the Insert Colorbar button on the toolbar.
Plot data from a pancreatic cancer study
Load the aCGH data from a pancreatic cancer study (Aguirre, A. et al., 2004).
load pancrea_oligocghDisplay a frequency plot of the copy number alterations across all samples using a green and red color scheme.
cghfreqplot(pancrea_data, 'Color', [0 1 0; 1 0 0])
Plotting groups of aCGH Data
Define two groups of data.
grp1 = strncmp('PA.C', pancrea_data.Sample,4);
grp1_ind = find(grp1);
grp2 = strncmp('PA.T', pancrea_data.Sample,4);
grp2_ind = find(grp2);
Display a frequency plot of the copy number alterations across all samples in the two groups and limit the plotting to only the clones with frequency gains or losses greater than or equal to 0.25.
SP = cghfreqplot(pancrea_data, 'Group', {grp1_ind, grp2_ind},...
                 'Title', {'CL', 'PT'}, 'Cutoff', 0.25);

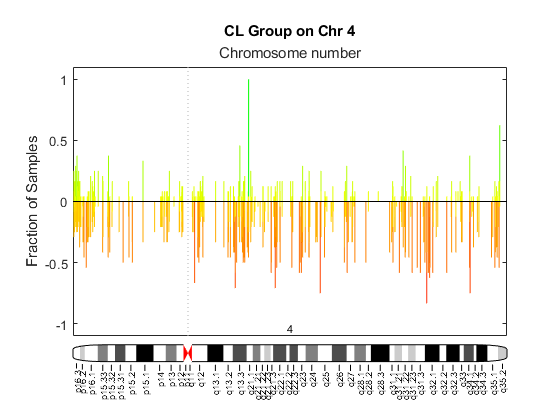
Display a frequency plot of the copy number alterations across all samples in the first group and limit the plot to chromosome 4 only.
SP = cghfreqplot(pancrea_data, 'Group', grp1_ind, ...
                 'Title', 'CL Group on Chr 4', 'Chromosome', 4);

Use the chromosomeplot function with the 'addtoplot' option to add the ideogram of chromosome 4 for Homo sapiens to this frequency plot. Because the plot of the frequency data from the pancreatic cancer study is in kb units, use the 'Unit' option to convert the ideogram data to kb units.
fh = gcf;
currentAxes = fh.CurrentAxes;
chromosomeplot('hs_cytoBand.txt', 4, 'addtoplot', currentAxes, 'Unit', 2);
References
[1] Snijders, A.M., Nowak, N., Segraves, R., Blackwood, S., Brown, N., Conroy, J., Hamilton, G., Hindle, A.K., Huey, B., Kimura, K., Law, S., Myambo, K., Palmer, J., Ylstra, B., Yue, J.P., Gray, J.W., Jain, A.N., Pinkel, D., and Albertson, D.G. (2001). Assembly of microarrays for genome-wide measurement of DNA copy number. Nature Genetics 29, 263–264.
[2] Aguirre, A.J., Brennan, C., Bailey, G., Sinha, R., Feng, B., Leo, C., Zhang, Y., Zhang, J., Gans, J.D., Bardeesy, N., Cauwels, C., Cordon-Cardo, C., Redston, M.S., DePinho, R.A., and Chin, L. (2004). High-resolution characterization of the pancreatic adenocarcinoma genome. PNAS 101, 24, 9067–9072.
Version History
Introduced in R2008a