Main Content

patternSystem

Visualize radiation patterns of multiple antennas installed on platform

Since R2024a

    Description

    patternSystem(object,frequency) plots the radiation patterns of all the antennas installed on a platform at the specified frequency.

    patternSystem(___,Name=Value) plots the radiation patterns with additional options specified by one or more Name-Value Arguments.

    example

    Examples

    collapse all

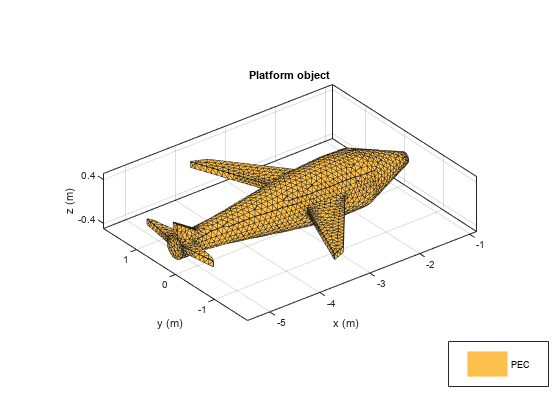
    Create a platform from the STL file containing the geometry information of a glider. View the platform.

    plat = platform(FileName="glider.stl", Units="m");
    figure
    show(plat);

    Figure contains an axes object. The axes object with title Platform object, xlabel x (m), ylabel y (m) contains 2 objects of type patch. This object represents PEC.

    Design a regular and a circular microstrip patch antenna operating at 2GHz. Install these antennas on the glider wings. View the glider with installed antennas.

    elem1 = design(patchMicrostrip, 2e9);
    elem2 = design(patchMicrostripCircular, 2e9);
    ant = installedAntenna(Platform=plat, Element={elem1, elem2},...
        ElementPosition=[-3.15 1.1 0.12; -3.15 -1.1 0.12]);
    figure
    show(ant)

    Figure contains 2 axes objects and another object of type uicontrol. Axes object 1 contains 5 objects of type patch, surface. Axes object 2 with title Installed antenna, xlabel x (m), ylabel y (m) contains 13 objects of type patch, surface, text. These objects represent PEC, feed, platform.

    Visualize the radiation patterns of the installed patch antennas.

    figure
    patternSystem(ant, 2e9, ElementNumber=1:2)

    Figure contains 2 axes objects and other objects of type uicontrol, uipanel. Hidden axes object 1 contains 43 objects of type surface, line, text, patch. Hidden axes object 2 contains 2 objects of type patch. This object represents platform.

    Input Arguments

    collapse all

    Platform-installed antennas to plot radiation patterns, specified as an installedAntenna object.

    Example: installedAntenna(Element={discone,monocone}, ElementPosition=[0.1 0.1 0.5; -0.1 -0.1 0.5])

    Frequency in Hz to plot radiation pattern, specified as a positive real scalar or vector. When you specify the frequency as a vector, the number of elements must match the number of antenna elements in the installedAntenna.

    Example: 70e6

    Example: [70e6 80e6]

    Data Types: double

    Name-Value Arguments

    Specify optional pairs of arguments as Name1=Value1,...,NameN=ValueN, where Name is the argument name and Value is the corresponding value. Name-value arguments must appear after other arguments, but the order of the pairs does not matter.

    Example: ElementNumber=1:4;

    Index numbers of antenna elements to plot radiation patterns, specified as an integer scalar or a vector.

    Example: 1

    Example: [1 2 3 4]

    Data Types: int16 | int32 | int64

    Plot visualization options, specified as a PatternPlotOptions object. Specify PatternOptions as a vector of PatternPlotOptions object to set the PatternOptions of individual antenna elements.

    Example: PatternPlotOptions(Transparency=0.6, MagnitudeScale=[1 10])

    Example: [PatternPlotOptions(Transparency=0.6, MagnitudeScale=[1 10]) PatternPlotOptions(Transparency=0.3)]

    Version History

    Introduced in R2024a

    Go to top of page