NR Cell Performance Evaluation with MIMO
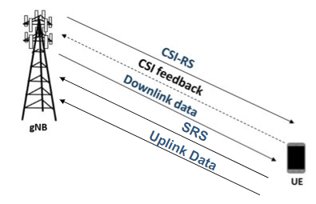
This example shows how to model a 5G New Radio (NR) cell with multiple-input multiple-output (MIMO) antenna configuration and evaluate the network performance. It uses multi-port channel state information reference signals (CSI-RS) to measure downlink (DL) channel characteristics. Alternatively, you can use sounding reference signals (SRS) for DL channel measurements in time division duplex (TDD) mode. To measure uplink (UL) channel characteristics, the example uses SRS signals. The gNB node uses this measured channel characteristics to make MIMO scheduling decisions.
Introduction
MIMO improves network performance by improving the cell throughput and reliability. The example performs layer mapping and precoding to utilize MIMO in the DL and UL directions.
This example models:
Single-codeword DL spatial multiplexing to perform multi-layer transmission. Single-codeword limits the number of transmission layers to 4.
Precoding to map the transmission layers to antenna ports. The example assumes one-to-one mapping from antenna ports to physical antennas.
DL channel quality measurement by UEs based on the multi-port CSI-RS received from the gNB. All the UEs in the cell measure on same CSI-RS resource.
DL channel quality measurement by the gNB node based on the multi-port SRS signals received from the UEs. It includes the DL rank, the precoding matrix and the modulation and coding scheme (MCS).
UL channel quality measurement by gNB based on the multi-port SRS received from the UEs.
DL rank indicator (RI), precoding matrix indicator (PMI), and channel quality indicator (CQI) reporting by UEs. The example supports Type-1 single-panel codebook for PMI.
3GPP TR 38.901 channel model.
Slot-based DL and UL scheduling.
Link-to-system-mapping-based abstract physical layer (PHY).
Frequency division duplex (FDD) mode. To model TDD mode, set the
DuplexModeproperty of thenrGNBobject to"TDD"and specify the value ofDLULConfigTDDproperty of thenrGNBobject.
This example assumes that nodes send the control packets (buffer status report (BSR), DL assignment, UL grants, PDSCH feedback, and CSI report) out of band, eliminating the requirement for transmission resources and ensuring error-free reception.
MIMO
The key aspects of MIMO include spatial multiplexing, precoding, channel measurement and reporting.
Spatial multiplexing
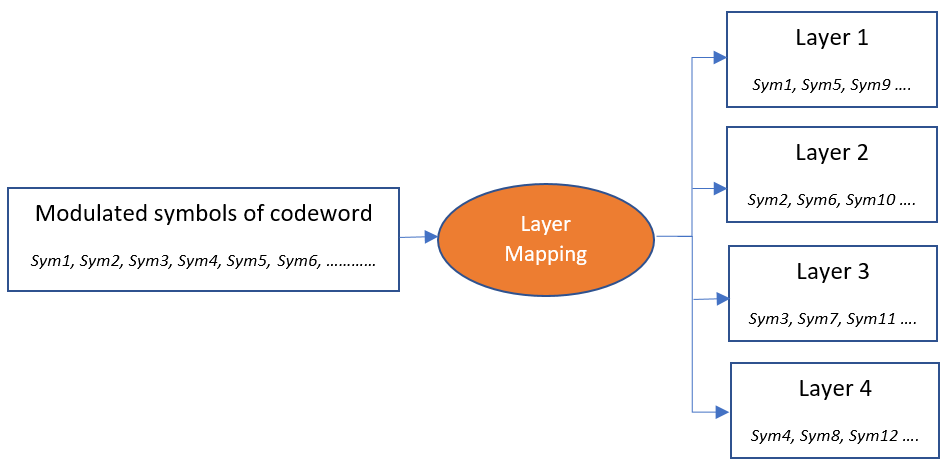
Spatial multiplexing utilizes MIMO to perform multi-layer transmission. The minimum of number of transmit and receive antennas limits the number of layers (or maximum rank). The layer mapping process maps the modulated symbols of the codeword onto different layers. It maps every symbol of the codeword to layer. For instance, this figure shows the mapping of a codeword onto four layers.
Furthermore, in both the UL and DL direction, NR specification allows for two codewords and supports up to a maximum of 8 transmission layers. The example currently supports only a single codeword for both DL and UL.
Precoding
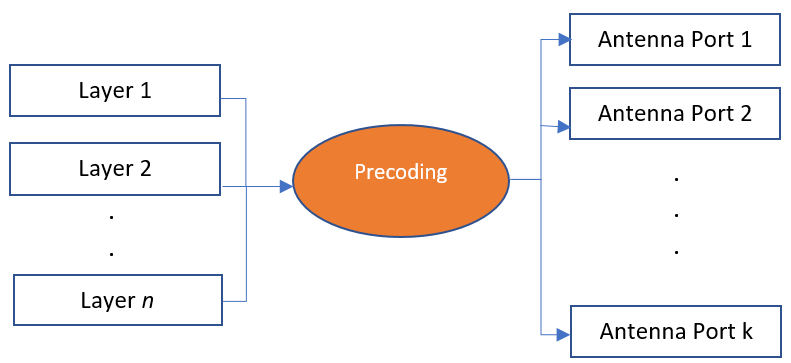
Precoding, which follows the layer mapping, maps the transmission layers to antenna ports. Precoding applies a precoding matrix to the transmission layers and outputs data streams to the antenna ports.
Channel measurement and reporting
It consists of DL channel measurement and reporting by the UEs and UL channel measurement by gNB.
DL channel measurement using CSI-RS and reporting
To measure the DL channel characteristics, UEs use CSI-RS. A gNB automatically configures a full bandwidth CSI-RS resource which all the UEs in the cell use. gNB sets the CSI-RS configuration such that number of CSI-RS ports are equal to number of transmit antennas on gNB. The periodicity for CSI-RS transmission is 10 slots for the FDD mode. For the TDD mode, the periodicity is a multiple of the length of the DL-UL pattern (in slots). In this case, the periodicity is the least value greater than or equal to 10 slots.
CSI reporting is the process by which a UE, for DL transmissions, advises a suitable number of transmission layers (rank), PMI, and CQI values to the gNB. The UE estimates these values by performing channel measurements on its configured CSI-RS resources. For more details, see the 5G NR Downlink CSI Reporting example. The gNB scheduler uses this advice to decide the number of transmission layers, precoding matrix, and modulation and coding scheme (MCS) for PDSCHs.
DL channel measurement using SRS for TDD system
In TDD systems, where both UL and DL transmissions operate within the same frequency band, you can also use SRS signals for measuring the DL channel characteristics. The radio channel shows identical properties in both UL and DL directions, exhibiting reciprocity. The reciprocity-based precoding technique exploits this property to derive a channel estimate from an uplink transmission, enabling the determination of parameters like precoder for a downlink transmission.
The gNB node estimates the uplink channel from SRS signals transmitted by the UE nodes. Using TDD reciprocity, the gNB then estimates the DL channel. This DL channel estimation aids in deriving the DL CSI, which includes the rank, precoder, and MCS for DL transmissions.
UL channel measurement
The UL channel measurements serve as an important input to the scheduler to decide the number of transmission layers, precoding matrix and MCS for PUSCHs.
To measure UL channel characteristics, gNB uses sounding reference signals (SRS). The gNB sets the SRS configuration such that number of SRS ports are equal to number of transmit antennas on UE. UEs transmit SRS periodically. The SRS transmission periodicity is a multiple of 'N' where 'N' is the interval in slots at which the gNB reserves one symbol for the SRS resource across the entire bandwidth. 'N' is 5 for FDD. For TDD, 'N' is the smallest value >= 5 slots such that it is multiple of length of the DL-UL pattern in slots. The gNB configures the UEs to share the reservation of SRS by differing the comb offset, cyclic shift, or transmission time. The comb size and maximum cyclic shift are both assumed as 4. In this case, gNB can configure up to 16 connected UEs to transmit SRS with a periodicity as 'N' slots. If more than 16 UEs are connected, increase the SRS transmission periodicity to the next higher valid value (a multiple of 'N'). For more details on SRS transmission periodicity, see the nrGNB.
Scenario simulation
Create a wireless network simulator.
rng("default") % Reset the random number generator numFrameSimulation =100; % Simulation time in terms of number of 10 ms frames networkSimulator = wirelessNetworkSimulator.init;
To use full PHY, set the PHY type, phyType, to "full-phy". To use abstract PHY, set phyType to "abstract-phy". All the nodes (gNB and UEs) must use the same PHY processing method.
phyType =  "abstract-phy";
To use SRS-based DL SU-MIMO, set the csiMeasurementSignalDLType to "SRS". The default value of the csiMeasurementSignalDLType is "CSI-RS".
csiMeasurementSignalDLType =  "CSI-RS";
Set duplexType to "TDD" or "FDD". For SRS-based DL SU-MIMO, you must set duplexType to "TDD".
duplexType =  "FDD";
Specify DL and UL time division configuration for TDD mode.
tddConfig = struct(DLULPeriodicity=5,NumDLSlots=2,NumDLSymbols=12,NumULSymbols=1,NumULSlots=2);
Create a gNB node and specify its name, position, carrier frequency, channel bandwidth, subcarrier spacing, duplex mode, TDD configuration, number of transmit and receive antennas, receive gain, and sounding reference signal (SRS) transmission periodicity (in slots) for all connecting UE nodes.
numTxAntennasGNB =16; if duplexType == "FDD" gNB = nrGNB(Name="gNB",Position=[0 0 30],CarrierFrequency=2.6e9,ChannelBandwidth=5e6, ... SubcarrierSpacing=15e3,DuplexMode=duplexType,NumTransmitAntennas=numTxAntennasGNB,NumReceiveAntennas=16, ... ReceiveGain=11,PHYModel=phyType,SRSPeriodicityUE=40); configureScheduler(gNB,CSIMeasurementSignalDL=csiMeasurementSignalDLType); else % TDD % Configure SRS-based downlink channel measurement parameters by setting the PrecoderFormat, MCSFormat and SubbandSize fields. precoderFormat =
"subband"; mcsFormat =
"wideband"; subbandSize =
4; srsMeasConfigDL = struct('PrecoderFormat', precoderFormat, 'MCSFormat', mcsFormat, 'SubbandSize', subbandSize); gNB = nrGNB(Name="gNB",Position=[0 0 30],CarrierFrequency=2.6e9,ChannelBandwidth=5e6, ... SubcarrierSpacing=15e3,DuplexMode=duplexType,DLULConfigTDD=tddConfig, ... NumTransmitAntennas=numTxAntennasGNB,NumReceiveAntennas=16,ReceiveGain=11,PHYModel=phyType, ... SRSPeriodicityUE=40,SRSMeasurementConfigDL=srsMeasConfigDL); configureScheduler(gNB,CSIMeasurementSignalDL=csiMeasurementSignalDLType); end
Create 4 UE nodes and specify their name, position, number of transmit and receive antennas, and receive gain.
uePositions = [300 0 3; 700 0 3; 1200 0 3; 3000 0 3];

ueNames = "UE-" + (1:size(uePositions,1));
UEs = nrUE(Name=ueNames,Position=uePositions,NumTransmitAntennas=4, ...
    NumReceiveAntennas=4,ReceiveGain=11,PHYModel=phyType);
Connect the UE nodes to gNB. Specify the radio link control (RLC) bearer configuration to establish an RLC bearer between the gNB and each UE node. Set the DL channel status information (CSI) report periodicity to 80 slots. Create and configure the CSI reporting configurations for multiple connections. Use the CSI report configuration with CQI table 2. Set the rank indicator (RI) restriction to [1 1 1 1 0 0 0 0] for UE1 and UE2, allowing up to 4 layers. Set the RI restriction to [1 1 0 0 0 0 0 0] for UE3 and UE4, allowing up to 2 layers. Configuration for ranks 5, 6, 7, or 8 is not supported. Set only the first four elements (for ranks 1–4) of 'RIRestriction' to either 0 or 1. The remaining elements (for ranks 5–8) must be 0. Configure sub-band measurements through the SubbandSize property of the nrCSIReportConfig. This parameter controls the reporting granularity for CQI and PMI by defining the number of resource blocks (RBs) in each sub-band for CSI reporting. For more details, see nrCSIReportConfigand nrCSIReportConfig name-value argument of the connectUE object function.
% Create an RLC bearer configuration object
rlcBearer = nrRLCBearerConfig(SNFieldLength=6,BucketSizeDuration=10);

% Calculate panel dimensions based on the number of transmit antennas
[Ng, N1, N2] = getPanelDimensions(numTxAntennasGNB);
% Create two CSI Report configuration object
reportConfig1 = nrCSIReportConfig;
reportConfig1.CQITable = "table2"; % Only CQITable 'table2' is supported
reportConfig1.PMIFormatIndicator = "wideband";
% The rank must be less than the number of transmit antennas at the gNB and the number of receive antennas at the UE
reportConfig1.RIRestriction = [1 1 1 1 0 0 0 0];
reportConfig1.PanelDimensions = [Ng, N1, N2];

reportConfig2 = nrCSIReportConfig;
reportConfig2.CQITable = "table2"; % Only CQITable 'table2' is supported
reportConfig2.PMIFormatIndicator = "subband";
reportConfig2.SubbandSize = 4;
% The rank must be less than the number of transmit antennas at the gNB and the number of receive antennas at the UE
reportConfig2.RIRestriction = [1 1 0 0 0 0 0 0];
reportConfig2.PanelDimensions = [Ng, N1, N2];

% Establish an RLC bearer between the gNB and UE nodes with the given CSI Report Periodicity and CSI Report Configuration
connectUE(gNB,UEs(1:2),RLCBearerConfig=rlcBearer,CSIReportPeriodicity=80,CSIReportConfig=reportConfig1);
connectUE(gNB,UEs(3:4),RLCBearerConfig=rlcBearer,CSIReportPeriodicity=80,CSIReportConfig=reportConfig2);
Set the periodic DL and UL application traffic pattern for UEs.
appDataRate =40000; % Application data rate in kilobits per second (kbps) appTraffic = networkTrafficOnOff(OnTime=numFrameSimulation*10e-3,OffTime=0, ... DataRate=appDataRate); % Install the DL application traffic on gNB for the UE node addTrafficSource(gNB,appTraffic,DestinationNode=UEs) % Install the UL application traffic on the UE nodes for the gNB addTrafficSource(UEs,appTraffic)
Add the gNB and UE nodes to the network simulator.
addNodes(networkSimulator,gNB)
addNodes(networkSimulator,UEs)
Use 3GPP TR 38.901 channel model for all links. You can also run the example with a CDL channel model.
channelModel ="3GPP TR 38.901"; if strcmp(channelModel,"CDL channel") % Create an N-by-N array of link-level channels, where N represents the number % of nodes in the cell. An element at index (i,j) contains the channel instance % from node i to node j. If the element at index (i,j) is empty, it indicates % the absence of a channel from node i to node j. Here i and j represents the % node IDs. channelConfig = struct(DelayProfile="CDL-C",DelaySpread=300e-9); channels = hNRCreateCDLChannels(channelConfig,gNB,UEs); % Create a custom channel model using channels and install the custom channel on % the simulator. Network simulator applies the channel to a packet in transit % before passing it to the receiver. channel = hNRCustomChannelModel(channels, ... struct(PHYModel=phyType)); addChannelModel(networkSimulator,@channel.applyChannelModel) else % Model a rural macro scenario, as defined in the 3GPP TR 38.901 channel model, % using the h38901Channel object. % Define scenario boundaries pos = reshape([gNB.Position UEs.Position],3,[]); % X-coordinate of the left edge of the scenario in meters minX = min(pos(1,:)); % Y-coordinate of the bottom edge of the scenario in meters minY = min(pos(2,:)); % Width (right edge of the 2D scenario) in meters, given as maxX - minX width = max(pos(1,:)) - minX; % Height (top edge of the 2D scenario) in meters, given as maxY - minY height = max(pos(2,:)) - minY; % Create the channel model channel = h38901Channel(Scenario="RMa",ScenarioExtents=[minX minY width height]); % Add the channel model to the simulator addChannelModel(networkSimulator,@channel.channelFunction); connectNodes(channel,networkSimulator); end
Set the enableTraces to true to log the traces. When you set the enableTraces parameter to false, the simulation does not log any traces. However, setting enableTraces to false can speed up the simulation.
enableTraces =  true;
true;Set up scheduling logger and PHY logger.
if enableTraces
    % Create an object to log scheduler traces
    simSchedulingLogger = helperNRSchedulingLogger(numFrameSimulation,gNB,UEs);
    % Create an object to log for PHY traces
    simPhyLogger = helperNRPhyLogger(numFrameSimulation,gNB,UEs);
end
Set the number of updates per second for the metric plots.
numMetricPlotUpdates =10; % Updates plots every 100 milliseconds
Set up metric visualizer.
metricsVisualizer = helperNRMetricsVisualizer(gNB,UEs, ...
    RefreshRate=numMetricPlotUpdates,PlotSchedulerMetrics=true, ...
    PlotPhyMetrics=true,PlotCDFMetrics=false);
Write the logs to MAT-file. You can use these logs for post-simulation analysis.
if enableTraces
    simulationLogFile = "simulationLogs"; % For logging the simulation traces
end
Configure a key performance indicator (KPI) manager to log application packet latency.
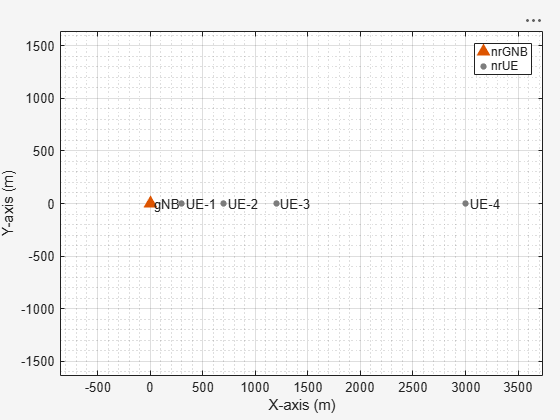
kpiManager = hNRKPIManager(Node={gNB,UEs},KPIString="app-latency");Display the network topology.
networkVisualizer = wirelessNetworkViewer;
addNodes(networkVisualizer,gNB)
addNodes(networkVisualizer,UEs)
Run the simulation for the specified numFrameSimulation frames.
% Calculate the simulation duration (in seconds)
simulationTime = numFrameSimulation * 1e-2;
% Run the simulation
run(networkSimulator,simulationTime);
Read per-node statistics.
gNBStats = statistics(gNB);
ueStats = statistics(UEs);
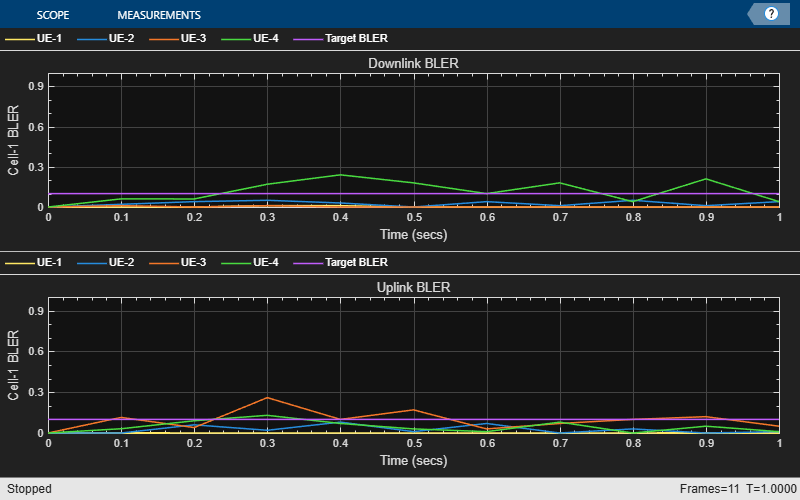
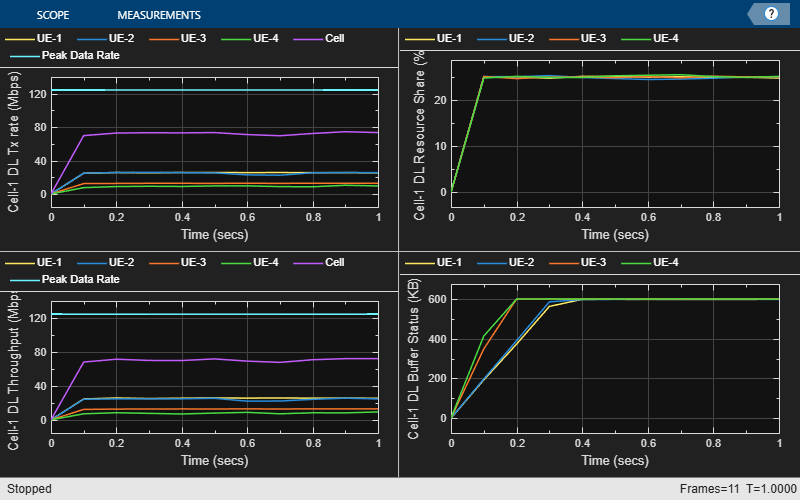
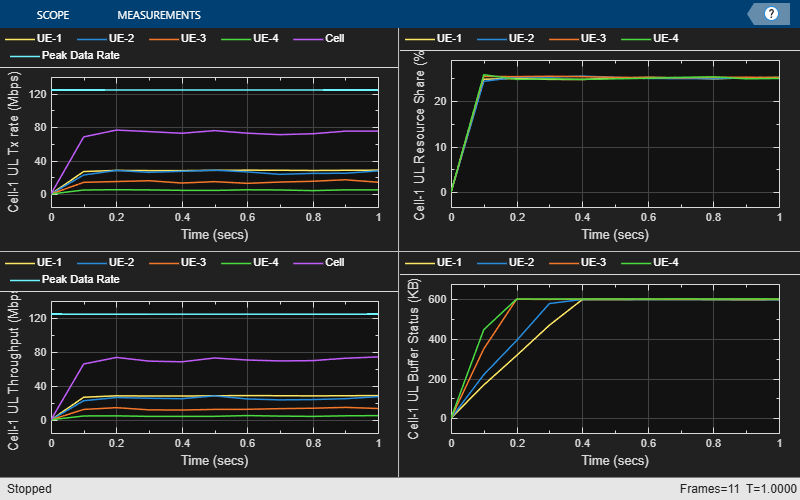
At the end of the simulation, compare the achieved values for system performance indicators with theoretical peak values (considering zero overheads). Performance indicators displayed are achieved data rate (UL and DL), achieved spectral efficiency (UL and DL), and block error rate (BLER) observed for UEs (UL and DL). The calculated peak values are in accordance with 3GPP TR 37.910.
displayPerformanceIndicators(metricsVisualizer)
Peak UL throughput: 124.42 Mbps
Achieved cell UL throughput: 70.57 Mbps
Achieved UL throughput for each UE: [28.12        25.12         12.9         4.44]
Peak UL spectral efficiency: 24.88 bits/s/Hz
Achieved UL spectral efficiency for cell: 14.11 bits/s/Hz
Block error rate for each UE in the UL direction: [0       0.028       0.105        0.05]

Peak DL throughput: 124.42 Mbps
Achieved cell DL throughput: 70.27 Mbps
Achieved DL throughput for each UE: [25.43        24.17        12.73         7.93]
Peak DL spectral efficiency: 24.88 bits/s/Hz
Achieved DL spectral efficiency for cell: 14.05 bits/s/Hz
Block error rate for each UE in the DL direction: [0.002       0.029       0.002       0.128]
Read the average application packet latency, in seconds, incurred by the gNB node when receiving UL traffic from the UE node.
ulAppLatency = kpi(kpiManager,UEs,gNB,"app-latency")ulAppLatency = 1×4
0.1255 0.1471 0.2770 0.4541
Read the average application packet latency, in seconds, incurred by the UE node when receiving DL traffic from the gNB node.
dlAppLatency = kpi(kpiManager,gNB,UEs,"app-latency")dlAppLatency = 1×4
0.1424 0.1505 0.2764 0.3929
Simulation Visualization
To evaluate the performance of the cell, the example includes various runtime visualizations. For further details on the runtime visualizations presented, refer to Simulation Visualizations.
Simulation Logs
This example stores the simulation logs in MAT-flies for the post-simulation analysis. The MAT-file simulationLogFile saves the per time step logs, the scheduling assignment logs, and the PHY reception logs. After the simulation, open the file to load DLTimeStepLogs, ULTimeStepLogs, SchedulingAssignmentLogs, PhyReceptionLogs in the workspace.
Time step logs: Both the DL and UL time step logs follow the same format. The table shows sample time step entries.
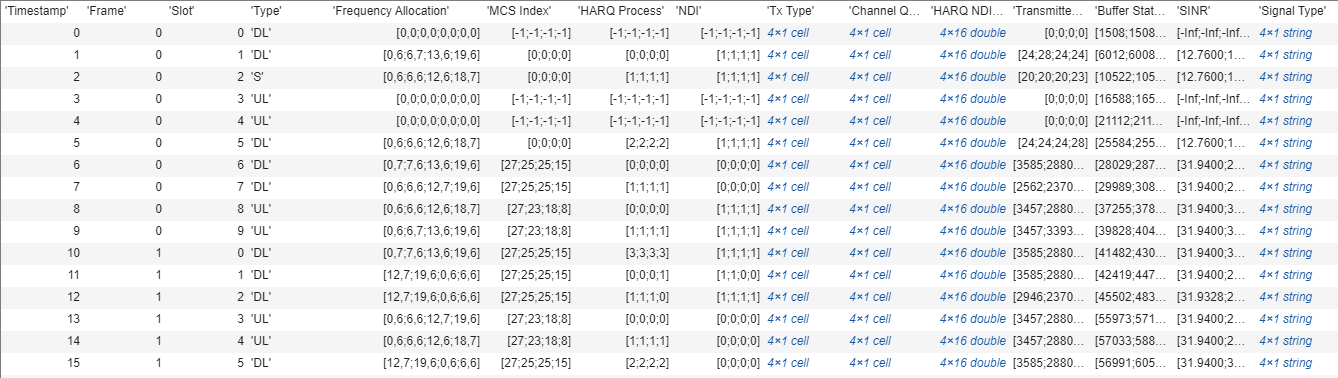
Each row of the table represents a slot and contains the following information:
Timestamp: Time (in milliseconds) since the start of simulation.
Frame: Frame number.
Slot: Slot number in the frame.
Type: Slot type. The values 'DL', 'UL', and 'S' indicate the downlink slot, uplink slot, and special slot, respectively.
Frequency Allocation: N-by-P matrix. N is the number of UEs. For frequency resource allocation type-1, P is 2. The first element of frequency resource allocation indicates the starting RB. The second element indicates the number of RBs allocated. For example, [0,6;6,6;12,7;19,6] indicates this: the scheduler has assigned 6 RBs (starting from 0) to UE-1, 6 RBs (starting from 6) to UE-2, 7 RBs (starting from 12) to UE-3, and 6 RBs (starting from 19) to UE-4. For frequency resource allocation type-0, P is the number of resource block groups (RBGs). The scheduler assigns an RBG to a particular UE by setting the corresponding bit to 1. For example, [ 0 0 1 1 0 1 0 1 0 1 0 0 0; 1 1 0 0 0 0 0 0 0 0 1 0 0; 0 0 0 0 1 0 1 0 1 0 0 1 1; 0 0 0 0 0 0 0 0 0 0 0 0 0] indicates that the bandwidth has 13 RBGs. The scheduler has assigned the RBG indices 2, 3, 5, 7, and 9 to UE-1, the RBG indices 0, 1, and 10 to UE-2, and the RBG indices 4, 6, 8, 11, and 12 to UE-3. The scheduler has not assigned any RBGs to UE-4.
MCS: Column vector of length N, where N is the number of UEs. Each value corresponds to the modulation and coding scheme (MCS) index for the transmission. For example, [10;12;8;-1] indicates these: a) the scheduler has assigned the resources to UE-1, UE-2, and UE-3 for this slot and b) UE-1, UE-2 AND UE-3 use the MCS values 10, 12, and 8, respectively. The MCS index corresponds to 3GPP TS 38.214 - Table 5.1.3.1-2.
HARQ Process: Column vector of length N, where N is the number of UEs. The value is the HARQ process ID used by UE for the transmission. For example, [0;3;6;-1] indicates these: a) the scheduler has assigned the resources to UE-1, UE-2, and UE-3 for this slot and b) UE-1, UE-2 AND UE-3 use the HARQ process IDs 0, 3, and 6, respectively.
NDI: Column vector of length N, where N is the number of UEs. The value is the new data indicator (NDI) flag value in the assignment for transmission. For example, [0;0;1;-1] indicates these: a) The scheduler has assigned the resources to UE-1, UE-2, and UE-3 for this slot and b) UE-1, UE-2, and UE-3 use the NDI flag values 0, 0, and 1, respectively. The NDI flag determines whether the UEs have used a new transmission or a retransmission.
Tx Type: Cell array of length N, where N is the number of UEs. Tx Type specifies the transmission type (new transmission or retransmission), specified as one of these values: '
newTx', 'reTx', or 'noTx'. 'noTx' indicates that the scheduler has not allocated the resources to the UE. For example, {'newTx' 'newTx' 'reTx' 'noTx'} indicates that the scheduler has assigned the resources to UE-1, UE-2, and UE-3 for this slot. UE-1 and UE-2 transmit a new packet from the specified HARQ process while UE-3 retransmits the packet in the buffer of the specified HARQ process.Channel Quality: Cell array of length N, where N is the number of UEs. An element at index i contains the channel quality information for UE with RNTI i.
HARQ NDI Status: N-by-P matrix, where N is the number of UEs and P is the number of HARQ processes on UEs. A matrix element at position (i, j) is the last received NDI flag at UE i for HARQ process ID j. For new transmissions, this value and the NDI flag in the assignment must toggle. For example, in slot 4 of frame 0 described in the scheduling log, the last NDI flag value for HARQ ID 3 at UE-1 is 1. To indicate a new transmission, the NDI flag value changes to 0.
Transmitted Bytes: Column vector of length N, where N is the number of UEs. The values represent MAC bytes transmitted per UE in this slot. The value only includes new transmission bytes. For retransmissions, the value is zero.
Buffer Status of UEs: Column vector of length N, where N is the number of UEs. The values represent the amount of pending buffer per UE.
SINR: Column vector of length N, where N represents the number of UE nodes. The values denote the effective signal to interference plus noise ratio received at the gNB or UE node. An SINR value of -Inf indicates that the simulator did not log the value at a particular slot.
Signal Type: A string vector of length N, where N is the number of UE nodes. Each string represents the signal types for a UE node, which can include PDSCH, CSIRS, PUSCH, SRS, or combinations of these used in specific slots. An empty string indicates no transmission for that UE node.
Scheduling assignment logs: A log of all the scheduling assignments and related information. The table shows sample log entries.
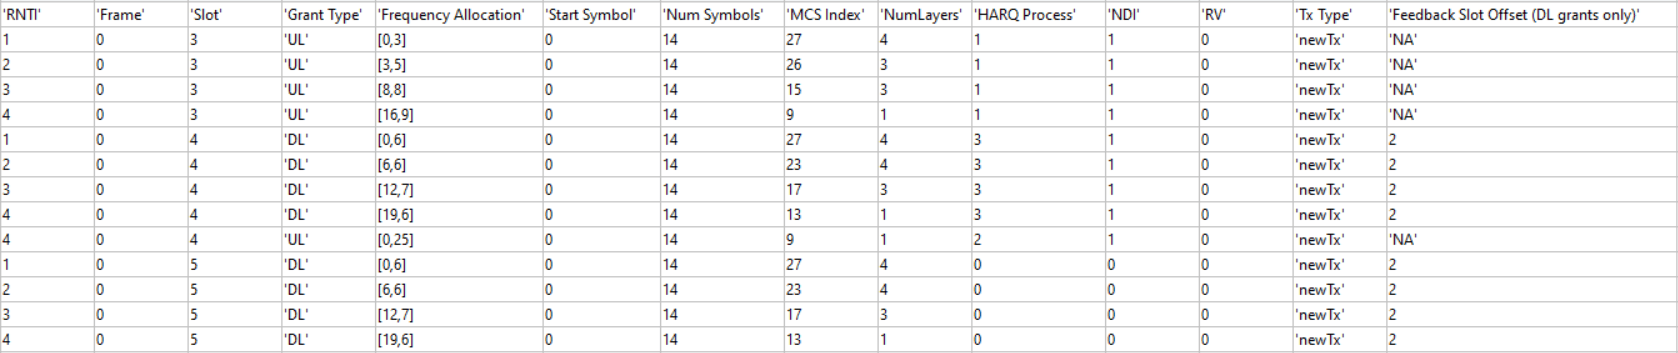
Each row of the table represents a DL or UL allocation grant and contains these information:
RNTI: Radio network temporary identifier of UE.
Frame: Frame number.
Slot: Slot number in the frame.
Grant Type: Grant type as 'DL' or 'UL'.
Frequency Allocation: Row vector of length P. For frequency resource allocation type-1, P is 2. For frequency resource allocation type-0, P is the number of RBGs.
Start Symbol: Start symbol for the transmission.
Num Symbols: Number of symbols for the transmission.
MCS Index: Modulation and coding scheme (MCS) index for the transmission.
NumLayers: Number of spatial layers for the transmission.
HARQ Process: HARQ process ID used for the transmission.
NDI: NDI flag value for transmission.
RV: Redundancy version for the transmission.
Tx Type: Transmission type, specified as one of these values: '
newTx', 'reTx'.Feedback Slot Offset (DL grants only): Slot offset for the feedback of PDSCH transmission.
PHY reception logs: A log of Phy packet reception information observed in the uplink and downlink directions. This table shows the sample log entries.

Each row of the table represents a slot and contains the following information:
Timestamp: Time (in milliseconds) since the start of simulation.
Frame: Frame number.
Slot: Slot number in the frame.
Symbol: Symbol number in the slot.
Number of Decode Failures (DL): Column vector of length N, where N is the number of UEs. The values represent the number of decode failures at the UE nodes in this slot.
Number of Packets (DL): Column vector of length N, where N is the number of UEs. The values represent the number of packets received at the UE nodes in this slot.
Number of Decode Failures (UL): Column vector of length N, where N is the number of UE nodes. The values represent the number of decode failures at the gNB for each UE node in this slot.
Number of Packets (UL): Column vector of length N, where N is the number of UE nodes. The values represent the number of packets received at the gNB for each UE node in this slot.
Save the simulation logs in a MAT file.
if enableTraces
    simulationLogs = cell(1,1);
    if gNB.DuplexMode == "FDD"
        logInfo = struct(DLTimeStepLogs=[],ULTimeStepLogs=[],...
            SchedulingAssignmentLogs=[],PhyReceptionLogs=[]);
        [logInfo.DLTimeStepLogs,logInfo.ULTimeStepLogs] = getSchedulingLogs(simSchedulingLogger);
    else % TDD
        logInfo = struct(TimeStepLogs=[],SchedulingAssignmentLogs=[],PhyReceptionLogs=[]);
        logInfo.TimeStepLogs = getSchedulingLogs(simSchedulingLogger);
    end
    % Obtain the scheduling assignments log
    logInfo.SchedulingAssignmentLogs = getGrantLogs(simSchedulingLogger);
    % Obtain the Phy reception logs
    logInfo.PhyReceptionLogs = getReceptionLogs(simPhyLogger);
    % Save simulation logs in a MAT-file
    simulationLogs{1} = logInfo;
    save(simulationLogFile,"simulationLogs")
end
Local functions
function [Ng, N1, N2] = getPanelDimensions(numAntennas)
% getPanelDimensions - Determine antenna panel configuration based on the number of antennas
%   getPanelDimensions calculates the antenna panel configuration,
%   specified as a row vector of positive integers of the form [Ng N1 N2].
%
%   numAntennas   - Number of antennas
%   Ng            - Number of antenna panels
%   N1            - Number of antenna elements in the horizontal direction
%   N2            - Number of antenna elements in the vertical direction

Ng = 1; % Single antenna panel

% Lookup table for common 5G NR configurations
% Format: [numAntennas, N1, N2, polarization]
configTable = [
    1,  1,  1,  1;
    2,  1,  1,  2;
    4,  1,  2,  2;
    8,  2,  2,  2;
    16, 4,  2,  2;
    32, 4,  4,  2];

% Find configuration
idx = configTable(:,1) == numAntennas;
if any(idx)
    N1 = configTable(idx, 2);
    N2 = configTable(idx, 3);
end
end
Further Exploration
Try running the example with these modifications.
Configure link adaptation parameters and analyze their impact on the key performance indicators. For more information on this, see
LinkAdaptationConfigDLinconfigureScheduler.Configure an SRS-based DL SU-MIMO and analyze its impact on the key performance indicators. For more information about the SRS-based DL SU-MIMO, see the
CSIMeasurementSignalDLname-value argument of theconfigureSchedulerobject function.Configure different CSI report configurations for different UEs and analyze its impact on the key performance indicators. For more information about the CSI report configuration, see the
CSIReportConfigname-value argument of theconnectUEobject function.Configure different sub-band sizes for CSI-RS and SRS-based DL measurements for different UEs and analyze their impact on the key performance indicators in a frequency-selective fading channel. For more information, see the
SubbandSizeproperty under theCSIReportConfigname-value argument of theconnectUEobject function for CSI-RS-based sub-band measurements, and theSRSMeasurementConfigDLproperty of thenrGNBconstructor for SRS-based DL sub-band measurements.Compare the wideband SINR for CSI-RS and SRS-based DL measurements. See the
AnalyzeDownlinkSINRUsingCSIRSAndSRS.mscript which demonstrates this workflow. This plot compares the SINRs for the SRS and CSI-RS signals in TDD systems. The plot shows similar SINRs for zero forcing precoding using SRS compared to codebook single panel type I CSI-RS. The channel model used is CDL-D (LoS). Try exploring alternative precoding algorithms and compare the results with the existing ones.

Supporting Functions
The example uses these helpers:
helperNRMetricsVisualizer: Implements metrics visualization functionalityhelperNRSchedulingLogger: Implements scheduling information logging functionalityhelperNRPhyLogger: Implements Phy packet reception information logging functionalityhNRCustomChannelModel: Implements channel modeling functionalityh38901Channel: Implements the 3GPP TR 38.901 channel modelhNRCreateCDLChannels: Creates CDL channels for gNB-to-UE and UE-to-gNB linkshNRKPIManager: Implements functionality for calculating key performance indicators
References
[1] 3GPP TS 38.104. “NR; Base Station (BS) radio transmission and reception.” 3rd Generation Partnership Project; Technical Specification Group Radio Access Network.
[2] 3GPP TS 38.214. “NR; Physical layer procedures for data.” 3rd Generation Partnership Project; Technical Specification Group Radio Access Network.
[3] 3GPP TS 38.321. “NR; Medium Access Control (MAC) protocol specification.” 3rd Generation Partnership Project; Technical Specification Group Radio Access Network.
[4] 3GPP TS 38.322. “NR; Radio Link Control (RLC) protocol specification.” 3rd Generation Partnership Project; Technical Specification Group Radio Access Network.
[5] 3GPP TS 38.323. “NR; Packet Data Convergence Protocol (PDCP) specification.” 3rd Generation Partnership Project; Technical Specification Group Radio Access Network.
[6] 3GPP TS 38.331. “NR; Radio Resource Control (RRC) protocol specification.” 3rd Generation Partnership Project; Technical Specification Group Radio Access Network.
[7] 3GPP TR 37.910. “Study on self evaluation towards IMT-2020 submission.” 3rd Generation Partnership Project; Technical Specification Group Radio Access Network.
See Also
Objects
wirelessNetworkSimulator(Wireless Network Toolbox) |nrGNB|nrUE