답변 있음
problem with 3d bar plot and colorbar
That appears to be <http://www.mathworks.com/matlabcentral/answers/53874-colorbar-error-how-to-fix-it this issue>. I asked th...
problem with 3d bar plot and colorbar
That appears to be <http://www.mathworks.com/matlabcentral/answers/53874-colorbar-error-how-to-fix-it this issue>. I asked th...
대략 10년 전 | 0
답변 있음
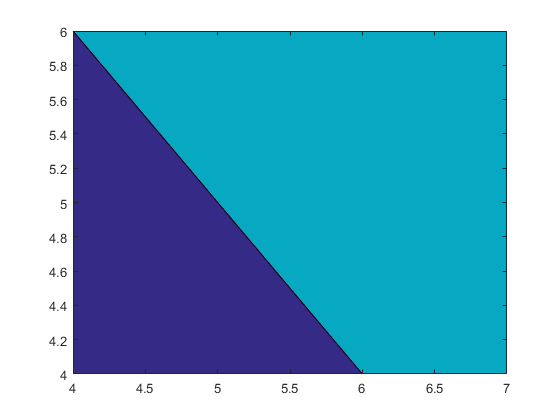
How to make a equilateral triangular piece in a rectangular meshgrid?
Meshgrid is going to create a rectangular mesh, but you can fill the parts you don't want with nan, as I described in <http://ww...
How to make a equilateral triangular piece in a rectangular meshgrid?
Meshgrid is going to create a rectangular mesh, but you can fill the parts you don't want with nan, as I described in <http://ww...
대략 10년 전 | 0
답변 있음
Plotting discontinuos X Data
You can use <http://www.mathworks.com/help/matlab/ref/nan.html nan> to represent discontinuities: datax = [6 7 8 9 nan 14 n...
Plotting discontinuos X Data
You can use <http://www.mathworks.com/help/matlab/ref/nan.html nan> to represent discontinuities: datax = [6 7 8 9 nan 14 n...
대략 10년 전 | 0
| 수락됨
답변 있음
Graphic problem on windows, but ok on Linux
No, that error message is talking about the data being passed into contour. It's not dependent on the graphics card or the rende...
Graphic problem on windows, but ok on Linux
No, that error message is talking about the data being passed into contour. It's not dependent on the graphics card or the rende...
대략 10년 전 | 1
| 수락됨
게시됨
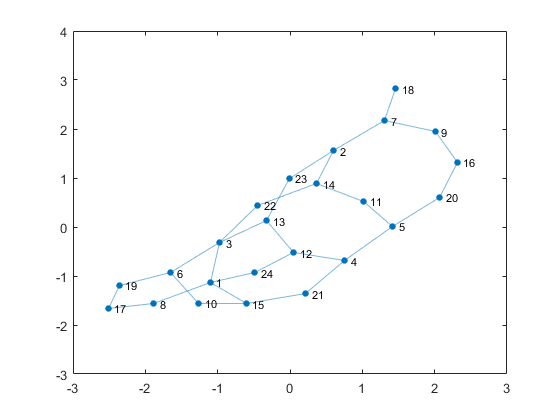
Interactive Graph Layout
I really like the new graph visualization functions that were introduced in R2015b. I particularly like the various options...
대략 10년 전
답변 있음
Plot3 mark first and last coordinate set?
The simplest way is to just create a second plot: plot3(x,y,z) hold on plot3([x(1),x(end)],[y(1),y(end)],[z(1),z(end)...
Plot3 mark first and last coordinate set?
The simplest way is to just create a second plot: plot3(x,y,z) hold on plot3([x(1),x(end)],[y(1),y(end)],[z(1),z(end)...
대략 10년 전 | 1
답변 있음
How can I draw equipotential surface?
<http://blogs.mathworks.com/graphics/2015/03/03/implicit-curves/ This post> I wrote for the MATLAB Graphics blog explains the ba...
How can I draw equipotential surface?
<http://blogs.mathworks.com/graphics/2015/03/03/implicit-curves/ This post> I wrote for the MATLAB Graphics blog explains the ba...
대략 10년 전 | 0
| 수락됨
답변 있음
How can I plot diagram in MATLAB
Here's a starting point. for i=1:3 subplot(3,1,i) plot(measured(i,:),'k') hold on plot(modeled(i,:),'k:...
How can I plot diagram in MATLAB
Here's a starting point. for i=1:3 subplot(3,1,i) plot(measured(i,:),'k') hold on plot(modeled(i,:),'k:...
대략 10년 전 | 0
| 수락됨
답변 있음
How can I create a bubble different size plot?
Do you mean something like this? <</matlabcentral/answers/uploaded_files/41664/speed.png>> Here's how I did that: % L...
How can I create a bubble different size plot?
Do you mean something like this? <</matlabcentral/answers/uploaded_files/41664/speed.png>> Here's how I did that: % L...
대략 10년 전 | 0
답변 있음
3D Histgram plot for [N,M] Matrix, visualize result monte carlo simulation
Is <http://www.mathworks.com/help/matlab/ref/histogram2.html histogram2> what you're looking for? <<http://www.mathworks.com/...
3D Histgram plot for [N,M] Matrix, visualize result monte carlo simulation
Is <http://www.mathworks.com/help/matlab/ref/histogram2.html histogram2> what you're looking for? <<http://www.mathworks.com/...
대략 10년 전 | 0
답변 있음
how to remove the remaining part of my plot
The function fill has a return argument. This is called a 'handle'. The handle has a delete method which you can call to get rid...
how to remove the remaining part of my plot
The function fill has a return argument. This is called a 'handle'. The handle has a delete method which you can call to get rid...
대략 10년 전 | 0
답변 있음
How to create a cuboid ?
<http://www.mathworks.com/help/matlab/visualize/multifaceted-patches.html This page of the doc> talks about how to use the <http...
How to create a cuboid ?
<http://www.mathworks.com/help/matlab/visualize/multifaceted-patches.html This page of the doc> talks about how to use the <http...
대략 10년 전 | 0
| 수락됨
답변 있음
Export a 3d plot with light in .eps in MATLAB
I'm afraid I don't know the whole story on this one, but I know part of it. If you've got a surface which only contains solid...
Export a 3d plot with light in .eps in MATLAB
I'm afraid I don't know the whole story on this one, but I know part of it. If you've got a surface which only contains solid...
대략 10년 전 | 0
답변 있음
Plotting real time data in matlab with Ni-daq, but view the entire graph as it is plotting
<http://www.mathworks.com/help/matlab/ref/animatedline-object.html This page> and <http://www.mathworks.com/help/matlab/ref/draw...
Plotting real time data in matlab with Ni-daq, but view the entire graph as it is plotting
<http://www.mathworks.com/help/matlab/ref/animatedline-object.html This page> and <http://www.mathworks.com/help/matlab/ref/draw...
대략 10년 전 | 0
| 수락됨
답변 있음
How to show the 3d volume transparently ?
The Renderer 'zbuffer' didn't support FaceAlpha. You'll need to use opengl.
How to show the 3d volume transparently ?
The Renderer 'zbuffer' didn't support FaceAlpha. You'll need to use opengl.
대략 10년 전 | 0
| 수락됨
답변 있음
Create intersection between surface and oriented planes
How is your surface defined? A patch object? Are the faces triangles, or perhaps quads? This <http://blogs.mathworks.com/grap...
Create intersection between surface and oriented planes
How is your surface defined? A patch object? Are the faces triangles, or perhaps quads? This <http://blogs.mathworks.com/grap...
대략 10년 전 | 2
답변 있음
Generate 3-D object
Have you tried the <http://www.mathworks.com/help/matlab/visualize/techniques-for-visualizing-scalar-volume-data.html isosurface...
Generate 3-D object
Have you tried the <http://www.mathworks.com/help/matlab/visualize/techniques-for-visualizing-scalar-volume-data.html isosurface...
대략 10년 전 | 0
| 수락됨
답변 있음
Why don't I see the graph? [No Graph visible in figure window without '+' or '.' argument]
When you're calling plot, you're passing in a single data point. The linespecs '.', '+', etc. are setting the property Marke...
Why don't I see the graph? [No Graph visible in figure window without '+' or '.' argument]
When you're calling plot, you're passing in a single data point. The linespecs '.', '+', etc. are setting the property Marke...
대략 10년 전 | 1
| 수락됨
답변 있음
patch object changes size when rotating with makehgtform in 2014b
It's the call to 'axis image'. I'll have to do some digging to figure out what changed there, but what are you trying to accompl...
patch object changes size when rotating with makehgtform in 2014b
It's the call to 'axis image'. I'll have to do some digging to figure out what changed there, but what are you trying to accompl...
대략 10년 전 | 1
| 수락됨
답변 있음
Contour of a 2d projection from 3d data
Look at the approach I used in my answer to <http://www.mathworks.com/matlabcentral/answers/258711-how-to-i-surf-or-3d-mesh-3-di...
Contour of a 2d projection from 3d data
Look at the approach I used in my answer to <http://www.mathworks.com/matlabcentral/answers/258711-how-to-i-surf-or-3d-mesh-3-di...
대략 10년 전 | 0
| 수락됨
답변 있음
How to I surf or 3D mesh 3 different scripts?(Boat)
You actually don't have enough information to unambiguously define the surface. Here's the classic illustration of that fact...
How to I surf or 3D mesh 3 different scripts?(Boat)
You actually don't have enough information to unambiguously define the surface. Here's the classic illustration of that fact...
대략 10년 전 | 1
게시됨
Contour and Infinities
In a recent post, I talked about an interesting edge case in the contour function. Today I'd like to talk about another one....
대략 10년 전
답변 있음
Use step size in surf and imagesc
You need to make up XData & YData arrays with the right values and pass them into surf & imagesc. Something like this: x = ...
Use step size in surf and imagesc
You need to make up XData & YData arrays with the right values and pass them into surf & imagesc. Something like this: x = ...
대략 10년 전 | 1
| 수락됨
답변 있음
Patch function gives crosses when multiple squares attempted
Yeah, this can be a bit confusing. If you look at the <http://www.mathworks.com/help/matlab/ref/patch.html help for the XYC ...
Patch function gives crosses when multiple squares attempted
Yeah, this can be a bit confusing. If you look at the <http://www.mathworks.com/help/matlab/ref/patch.html help for the XYC ...
대략 10년 전 | 1
답변 있음
minor grid line spacing on log axes of less than 1 decade (answered by myself)
They're not really log spaced differently. Let's look at an example: ydat = linspace(1,100,500); semilogy(ydat) ax...
minor grid line spacing on log axes of less than 1 decade (answered by myself)
They're not really log spaced differently. Let's look at an example: ydat = linspace(1,100,500); semilogy(ydat) ax...
대략 10년 전 | 2
답변 있음
Plot several signals but I want nudging or not overlap between them
There are a couple of approaches. If you want to put all of the plots in the same axes, then they're going to share the same...
Plot several signals but I want nudging or not overlap between them
There are a couple of approaches. If you want to put all of the plots in the same axes, then they're going to share the same...
대략 10년 전 | 0
| 수락됨
답변 있음
Which data are stored in handles of boxplot?
They're the handles of the line objects it created. They've been cast to double (because it's rather old code), but if you're us...
Which data are stored in handles of boxplot?
They're the handles of the line objects it created. They've been cast to double (because it's rather old code), but if you're us...
대략 10년 전 | 0
답변 있음
Combine LineStyleOrder and ColorOrder?!?
Update Starting in MATLAB R2023a you can cycle through LineStyleOrder and ColorOrder together by setting LineStyleCyclingMethod...
Combine LineStyleOrder and ColorOrder?!?
Update Starting in MATLAB R2023a you can cycle through LineStyleOrder and ColorOrder together by setting LineStyleCyclingMethod...
대략 10년 전 | 1
| 수락됨
답변 있음
painters renderer ignoring uistack and z values in R2014b
You need to learn about the SortMethod property on the <http://www.mathworks.com/help/matlab/ref/axes-properties.html axes>. I t...
painters renderer ignoring uistack and z values in R2014b
You need to learn about the SortMethod property on the <http://www.mathworks.com/help/matlab/ref/axes-properties.html axes>. I t...
대략 10년 전 | 1
| 수락됨
답변 있음
Why does turning the visibility of a figure to "off" slow things down?
They actually don't do the same thing at all. In the Visible='on' case, the pixels are already sitting in the framebuffer on ...
Why does turning the visibility of a figure to "off" slow things down?
They actually don't do the same thing at all. In the Visible='on' case, the pixels are already sitting in the framebuffer on ...
대략 10년 전 | 0