이 번역 페이지는 최신 내용을 담고 있지 않습니다. 최신 내용을 영문으로 보려면 여기를 클릭하십시오.
결정 트리 보기
이 예제에서는 분류 트리 또는 회귀 트리가 어떻게 표시되는지 보여줍니다. 트리를 보는 두 가지 방법이 있습니다. view(tree)는 트리에 대한 텍스트 설명을 반환하고 view(tree,'mode','graph')는 트리에 대한 시각적 설명을 반환합니다.
분류 트리를 만들고 봅니다.
load fisheriris % load the sample data
ctree = fitctree(meas,species); % create classification tree
view(ctree) % text description
Decision tree for classification
1  if x3<2.45 then node 2 elseif x3>=2.45 then node 3 else setosa
2  class = setosa
3  if x4<1.75 then node 4 elseif x4>=1.75 then node 5 else versicolor
4  if x3<4.95 then node 6 elseif x3>=4.95 then node 7 else versicolor
5  class = virginica
6  if x4<1.65 then node 8 elseif x4>=1.65 then node 9 else versicolor
7  class = virginica
8  class = versicolor
9  class = virginica
view(ctree,'mode','graph') % graphic description
이제 회귀 트리를 만들고 봅니다.
load carsmall % load the sample data, contains Horsepower, Weight, MPG
X = [Horsepower Weight];
rtree = fitrtree(X,MPG,'MinParent',30); % create classification tree
view(rtree) % text description
Decision tree for regression
1  if x2<3085.5 then node 2 elseif x2>=3085.5 then node 3 else 23.7181
2  if x1<89 then node 4 elseif x1>=89 then node 5 else 28.7931
3  if x1<115 then node 6 elseif x1>=115 then node 7 else 15.5417
4  if x2<2162 then node 8 elseif x2>=2162 then node 9 else 30.9375
5  fit = 24.0882
6  fit = 19.625
7  fit = 14.375
8  fit = 33.3056
9  fit = 29
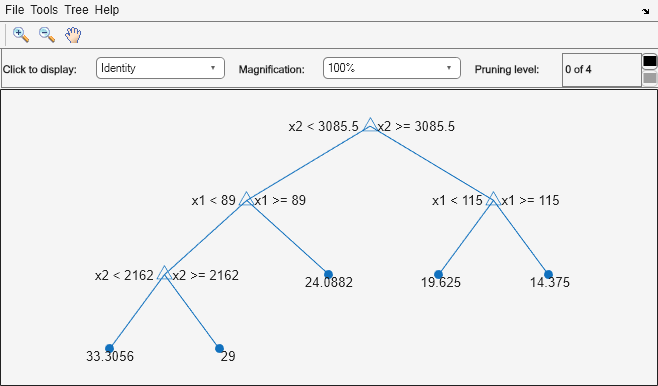
view(rtree,'mode','graph') % graphic description
참고 항목
fitctree | fitrtree | view (CompactClassificationTree) | view (CompactRegressionTree)