판별분석 분류기를 만들고 시각화하기
이 예제에서는 피셔의 붓꽃 데이터에 대한 선형 분류와 2차 분류를 수행하는 방법을 보여줍니다.
표본 데이터를 불러옵니다.
load fisheriris열 벡터 species는 세 가지 붓꽃 종인 setosa, versicolor, virginica로 구성됩니다. double형 행렬 meas는 꽃에 대한 네 가지 측정값 유형인 꽃받침 길이, 꽃받침 너비, 꽃잎 길이, 꽃잎 너비(단위: 센티미터)를 포함합니다.
꽃잎 길이(meas의 세 번째 열) 측정값과 꽃잎 너비(meas의 네 번째 열) 측정값을 사용합니다. 이러한 측정값을 각각 변수 PL 및 PW로 저장합니다.
PL = meas(:,3);
PW = meas(:,4);
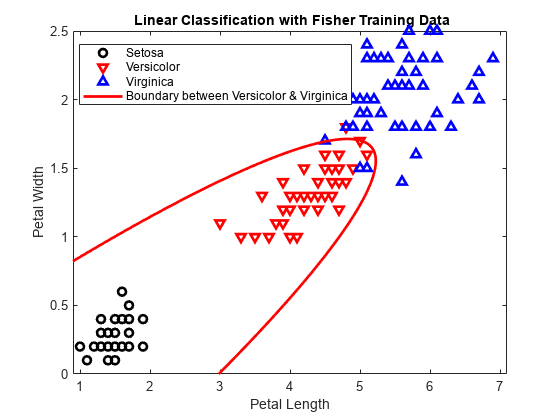
분류를 표시하기 위해 데이터를 플로팅합니다. 즉, 종별로 그룹화된 측정값의 산점도 플롯을 만듭니다.
h1 = gscatter(PL,PW,species,'krb','ov^',[],'off');
h1(1).LineWidth = 2;
h1(2).LineWidth = 2;
h1(3).LineWidth = 2;
legend('Setosa','Versicolor','Virginica','Location','best')
hold on

선형 분류기를 만듭니다.
X = [PL,PW];
MdlLinear = fitcdiscr(X,species);
두 번째 클래스와 세 번째 클래스 사이의 선형 경계에 대한 계수를 가져옵니다.
MdlLinear.ClassNames([2 3])
ans = 2×1 cell
    {'versicolor'}
    {'virginica' }
K = MdlLinear.Coeffs(2,3).Const;
L = MdlLinear.Coeffs(2,3).Linear;
두 번째 클래스와 세 번째 클래스를 구분하는 곡선을 플로팅합니다.
f = @(x1,x2) K + L(1)*x1 + L(2)*x2;
h2 = fimplicit(f,[.9 7.1 0 2.5]);
h2.Color = 'r';
h2.LineWidth = 2;
h2.DisplayName = 'Boundary between Versicolor & Virginica';

첫 번째 클래스와 두 번째 클래스 사이의 선형 경계에 대한 계수를 가져옵니다.
MdlLinear.ClassNames([1 2])
ans = 2×1 cell
    {'setosa'    }
    {'versicolor'}
K = MdlLinear.Coeffs(1,2).Const;
L = MdlLinear.Coeffs(1,2).Linear;
첫 번째 클래스와 두 번째 클래스를 구분하는 곡선을 플로팅합니다.
f = @(x1,x2) K + L(1)*x1 + L(2)*x2;
h3 = fimplicit(f,[.9 7.1 0 2.5]);
h3.Color = 'k';
h3.LineWidth = 2;
h3.DisplayName = 'Boundary between Versicolor & Setosa';
axis([.9 7.1 0 2.5])
xlabel('Petal Length')
ylabel('Petal Width')
title('{\bf Linear Classification with Fisher Training Data}')

2차 판별 분류기를 만듭니다.
MdlQuadratic = fitcdiscr(X,species,'DiscrimType','quadratic');
플롯에서 선형 경계를 제거합니다.
delete(h2);
delete(h3);

두 번째 클래스와 세 번째 클래스 사이의 2차 경계에 대한 계수를 가져옵니다.
MdlQuadratic.ClassNames([2 3])
ans = 2×1 cell
    {'versicolor'}
    {'virginica' }
K = MdlQuadratic.Coeffs(2,3).Const;
L = MdlQuadratic.Coeffs(2,3).Linear;
Q = MdlQuadratic.Coeffs(2,3).Quadratic;
두 번째 클래스와 세 번째 클래스를 구분하는 곡선을 플로팅합니다.
f = @(x1,x2) K + L(1)*x1 + L(2)*x2 + Q(1,1)*x1.^2 + ...
    (Q(1,2)+Q(2,1))*x1.*x2 + Q(2,2)*x2.^2;
h2 = fimplicit(f,[.9 7.1 0 2.5]);
h2.Color = 'r';
h2.LineWidth = 2;
h2.DisplayName = 'Boundary between Versicolor & Virginica';

첫 번째 클래스와 두 번째 클래스 사이의 2차 경계에 대한 계수를 가져옵니다.
MdlQuadratic.ClassNames([1 2])
ans = 2×1 cell
    {'setosa'    }
    {'versicolor'}
K = MdlQuadratic.Coeffs(1,2).Const;
L = MdlQuadratic.Coeffs(1,2).Linear;
Q = MdlQuadratic.Coeffs(1,2).Quadratic;
첫 번째 클래스와 두 번째 클래스를 구분하는 곡선을 플로팅합니다.
f = @(x1,x2) K + L(1)*x1 + L(2)*x2 + Q(1,1)*x1.^2 + ...
    (Q(1,2)+Q(2,1))*x1.*x2 + Q(2,2)*x2.^2;
h3 = fimplicit(f,[.9 7.1 0 1.02]); % Plot the relevant portion of the curve.
h3.Color = 'k';
h3.LineWidth = 2;
h3.DisplayName = 'Boundary between Versicolor & Setosa';
axis([.9 7.1 0 2.5])
xlabel('Petal Length')
ylabel('Petal Width')
title('{\bf Quadratic Classification with Fisher Training Data}')
hold off
