Use Events to Execute Charts
Events control when Stateflow charts execute. Event-triggered charts remain inactive until an event wakes them up. The chart then processes the required actions and returns to an inactive state. Using events to control Stateflow® charts reduce computational load and ensures charts only run when needed. In automotive, aerospace, and other control applications, events can coordinate multiple charts and subsystems by triggering execution at specific moments.
When an event-triggered chart receives an event, it follows a standard execution sequence: wake up, execute transitions and actions from top to bottom through the chart hierarchy, then become inactive. Events can interrupt ongoing actions, and charts handle these interruptions using early return logic to maintain consistent behavior. Events queue when a chart is busy, ensuring no events are lost during execution.
For more information, see Synchronize Model Components by Using Events.
How Stateflow Charts Respond to Events
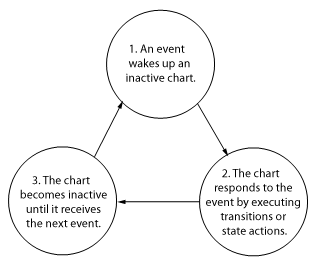
Stateflow charts respond to events in a cyclical manner.
An event wakes up an inactive chart.
The chart responds to the event by executing transitions and state actions from the top down through the chart hierarchy. Starting at the chart level:
The chart checks for valid transitions between states.
The chart executes
duringandonactions for the active state.The chart proceeds to the next level down the hierarchy.
The chart becomes inactive until it receives the next event.
For more information, see Execution of a Stateflow Chart.
Events in Simulink Models
In Simulink® models, Stateflow charts receive input events from other blocks in the model.
While processing an event, a state or transition action can generate explicit or implicit events that trigger additional steps. For example:
In each case, the chart interrupts its current activity to process the new event. When the activity caused by the new event finishes executing, the chart returns to the activity that was taking place before the interruption.
Note
In a Simulink model, the execution of output edge-trigger events is equivalent to toggling the value of an output data value between 0 and 1. This type of event does not interrupt the current activity of a chart. Instead, the receiving block processes the event the next time that the model executes the block. For more information, see Activate a Simulink Block by Sending Output Events.
Early Return Logic
When Stateflow charts process events, they might encounter timing conflicts. For example, a local event can interrupt and invalidate the action that generated it. Early return logic checks that when a local event changes the state configuration, any ongoing actions are evaluated for validity. If the action that initiated the event is no longer valid, the chart terminates that action early rather than completing potentially contradictory operations.
Early return logic affects action types based on their relationship to the state activity. Actions that depend on specific states being active terminate if those states become inactive during local event processing.
Action Type | Early Return Logic |
|---|---|
State entry action | If the state is no longer active after the local event is
processed, the chart stops the process of entering the state. The chart
does not perform the remaining statements in the If an event
inside an |
State during action | If the state is no longer active after the local event is processed, the
chart stops executing the state. The chart does not perform the remaining
statements in the during action. |
State exit action | If the state is no longer active after the local event is processed, the
chart stops the process of exiting the state. The chart does not perform the
remaining statements in the exit action nor any
transition actions and state entry actions that result
from exiting the state. |
| Condition action | If the source state of the inner or outer transition path, or the parent
state of the default transition path, is no longer active after the local
event is processed, the chart stops the transition process. The chart does
not perform the remaining actions on the transition path or any state
exit and entry actions that result
from taking the transition. |
| Transition action | If the parent of the transition path is not active, or if the parent has
an active substate, the chart stops the transition process. The chart does
not perform the remaining actions on the transition path or any state
entry actions that result from taking the
transition. |
For example, in this chart, the input event E and the local event
F trigger the transitions between states.
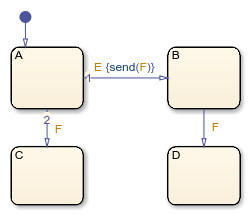
Suppose that state A is active when the chart receives event
E. The chart responds to the event with these steps:
The chart determines that the transition from the active state
Ato stateBis valid as a result of eventE.The chart executes the condition action of the valid transition and broadcasts event
F.The chart interrupts the transition from state
Ato stateBand begins to process eventF.The chart determines that the transition from the active state
Ato stateCis valid as a result of eventF.State
Aexecutes itsexitaction.State
Abecomes inactive.State
Cbecomes active.State
Cexecutes itsentryaction.
After the chart processes event F, state C is
the active state of the chart. Because state A is no longer active,
the chart uses early return logic and stops the transition from state
A to state B.
Tip
Avoid using undirected local event broadcasts and directed local events that create early return logic. These events can cause unwanted recursive behavior in your chart. If your chart contains these events, it generates a warning when you simulate the model. To remove events that cause recursion, see Resolve Unintended Recursive Behavior.
Events in Standalone Charts
Standalone Stateflow charts receive an input event when you call the step
function or an input event function in MATLAB®.
Standalone charts also receive implicit events from MATLAB
timer objects associated with the
absolute-time temporal logic operators after, at, and every. These operators define temporal logic in terms of
wall-clock time. If the state associated with the temporal logic operator becomes
inactive before the chart processes the implicit event, the event does not wake up the
chart.
Queuing of Events
If a chart is processing another operation when it receives an event, the chart
queues the event for execution when the current step is completed. You can specify
the size of the event queue by setting the configuration option
-eventQueueSize when you create the chart object. For more
information, see Chart Object Configuration Options.
For example, in this chart, the input events E and
F trigger the transitions between states. Assume that
SendF is a function in the MATLAB path that calls the input event function F.
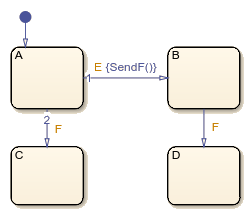
Suppose that state A is active when the chart receives event
E. The chart responds to the event with these steps:
The chart determines that the transition from the active state
Ato stateBis valid as a result of eventE.The chart executes the condition action of the valid transition and calls the function
SendF.SendFcalls the input event functionF. Because the chart is busy processing a condition action, it queues eventF.The chart completes executing the condition action.
State
Aexecutes itsexitaction.State
Abecomes inactive.State
Bbecomes active.State
Bexecutes itsentryaction.The chart begins to process the queued event
F.The chart determines that the transition from the active state
Bto stateDis valid as a result of eventF.State
Bexecutes itsexitaction.State
Bbecomes inactive.State
Dbecomes active.State
Dexecutes itsentryaction.
After the chart processes event F, state D
is the active state of the chart.
Control Chart Execution by Using Event Actions in a Superstate
The following example shows the use of event actions in a superstate.
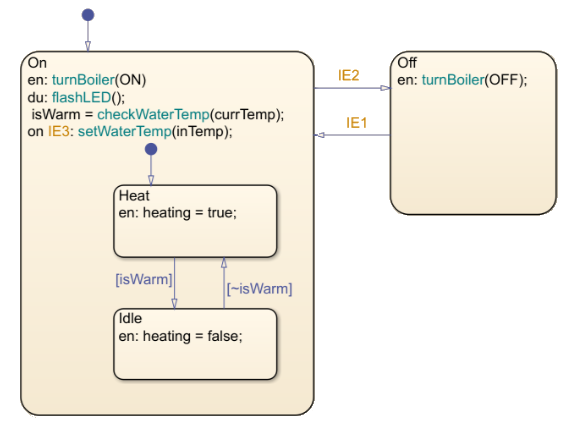
In this example, the Stateflow chart is an event-triggered chart above with three input events:
IE1, IE2, and IE3. When
event IE3 occurs, and the Heat state is active,
the chart processes the event through the chart hierarchy.
The chart checks to see if there is a valid transition for
IE3. No valid transition exists.State
Onexecutes during actions to flash the LED and check the water temperature.State
Onexecutes and completes theoneventIE3action to set water temperature.State
Onchecks its child states for valid transitions.If the water temperature is warm, the chart transitions from state
HeattoIdleand stateIdleexecutes its entry actions.If the water temperature is not warm, the chart stays in state
Heat.The chart goes back to sleep.
This sequence completes the execution of the Stateflow chart associated with event IE3.
See Also
after | at | change | enter | every | exit | send | timer