Stateflow.op.BlockOperatingPoint
Operating point information for Stateflow chart
Description
A Stateflow.op.BlockOperatingPoint object contains a snapshot of
a Stateflow® chart during simulation. The operating point includes information
about:
Active states
Chart output data
Chart, state, and function local data
Persistent variables in MATLAB® functions and truth tables
Creation
When you save the final operating point for a Simulink® model, as described in Save Operating Points, you create a Simulink.op.ModelOperatingPoint (Simulink) object that contains a
Stateflow.op.BlockOperatingPoint object for each Stateflow chart in the model.
Access the Stateflow.op.BlockOperatingPoint object for a chart by calling
the get (Simulink) function
and using the block path to the chart. For example, if the final operating point for the model
is xFinal and the block path to your chart is
"myModel/Chart", enter:
op = get(xFinal,"myModel/Chart");Properties
The Stateflow.op.BlockOperatingPoint object contains a property for each
state, box, function, local data, and output data in the chart. The name of the property
matches the name of the state, function, box, or data. For example:
If a chart has a state named
state, theStateflow.op.BlockOperatingPointobject for the chart has a property namedstatethat is aStateflow.op.OperatingPointContainerobject.If a chart has a chart output named
output, theStateflow.op.BlockOperatingPointobject for the chart has a property namedoutputthat is aStateflow.op.OperatingPointDataobject.
Object Functions
highlightActiveStates | Highlight active states |
removeHighlighting | Remove highlighting of active states |
clone | Copy operating point for Stateflow chart |
open | Display object in editing environment |
Examples
Open the
sf_carmodel.openExample("sf_car")For more information about this model, see Model a Car with Automatic Transmission.
Set the model to save the final operating point. Open the Configuration Parameters dialog box and, in the Data Import/Export pane:
Select Final states and enter a name for the operating point. For this example, use
xSteadyState.Select Save final operating point.
Click OK.
Set the stop time for this simulation segment. In the Simulation tab, set Stop Time to
3.Run the simulation.
Access the
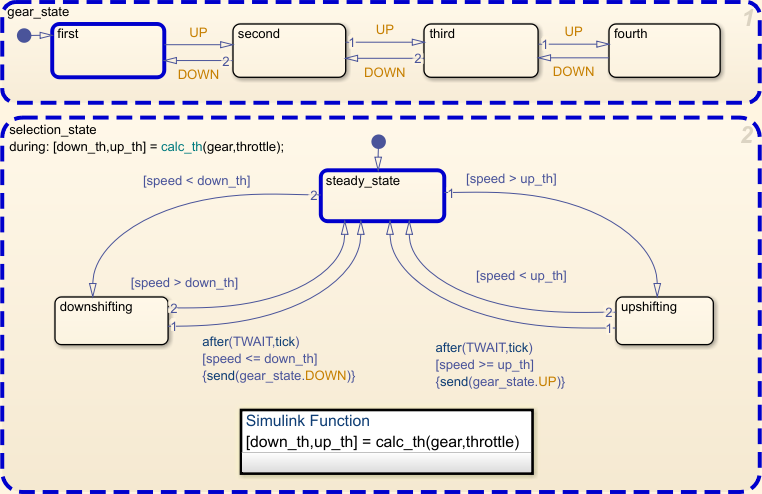
Stateflow.op.BlockOperatingPointobject that contains the operating point information for theshift_logicchart.blockpath = "sf_car/shift_logic"; op = get(xSteadyState,blockpath)op = Block: "shift_logic" (handle) (active) Path: sf_car/shift_logic Contains: + gear_state "State (AND)" (active) + selection_state "State (AND)" (active) gear "State output data" gearType [1, 1] down_th "Local data" double [1, 1] up_th "Local data" double [1, 1] datasetWrittenToVector "Data set written to vector" logical 4x1Access the
Stateflow.op.OperatingPointContainerobject that contains the operating point information for thegear_statestate.op.gear_state
ans =

State: "gear_state"    (handle)    (active)
  Path:     sf_car/shift_logic/gear_state

  Contains:

    + first          "State (OR)"         (active)
    + fourth         "State (OR)"
    + second         "State (OR)"
    + third          "State (OR)"
Highlight the states that are active in the chart at t = 3.
highlightActiveStates(op)
Change the substate activity in the state
gear_stateto reflect a change in gear.setActive(op.gear_state.second)
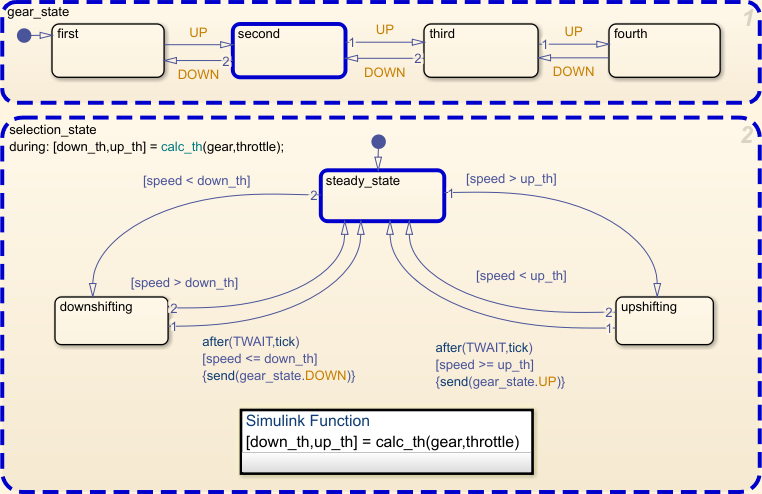
Verify that the substate
secondin the stategear_stateis active in the modified operating point.isActive(op.gear_state.second)
ans =

  logical

   1
Remove the highlighting of active states in the Stateflow Editor.
removeHighlighting(op)
Open the model
old_sf_car.openExample("old_sf_car")Set the model to save the final operating point. Open the Configuration Parameters dialog box and, in the Data Import/Export pane:
Select Final states and enter a name for the operating point. For this example, use
xSteadyState.Select Save final operating point.
Click OK.
Set the stop time for this simulation segment. In the Simulation tab, set Stop Time to
10.Run the simulation.
Access the
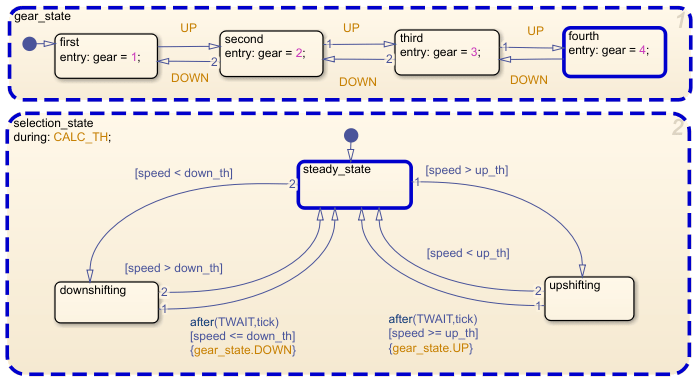
Stateflow.op.BlockOperatingPointobject that contains the operating point information for theshift_logicchart.blockpath = "old_sf_car/shift_logic"; op = get(xSteadyState,blockpath)op = Block: "shift_logic" (handle) (active) Path: old_sf_car/shift_logic Contains: + gear_state "State (AND)" (active) + selection_state "State (AND)" (active) gear "Block output data" double [1, 1]Highlight the states that are active in the chart at t = 10.
highlightActiveStates(op)
Access the
Stateflow.op.OperatingPointDataobject that contains the operating point information for the chart outputgear.op.gear
ans =

      Description: 'Block output data'
         DataType: 'double'
             Size: '[1, 1]'
            Range: [1x1 struct]
     InitialValue: [1x0 double]
            Value: 4
Change the value of
gearto1.op.gear.Value = 1;
Inspect the modified operating point information for the chart output
gear.op.gear
ans =

      Description: 'Block output data'
         DataType: 'double'
             Size: '[1, 1]'
            Range: [1x1 struct]
     InitialValue: [1x0 double]
            Value: 1
Version History
Introduced in R2009bSee Also
Objects
Stateflow.op.OperatingPointContainer|Stateflow.op.OperatingPointData|Simulink.op.ModelOperatingPoint(Simulink)
Functions
get(Simulink)